August 08, 2025 a 04:28 am


NZDJPY: Trend and Support & Resistance Analysis
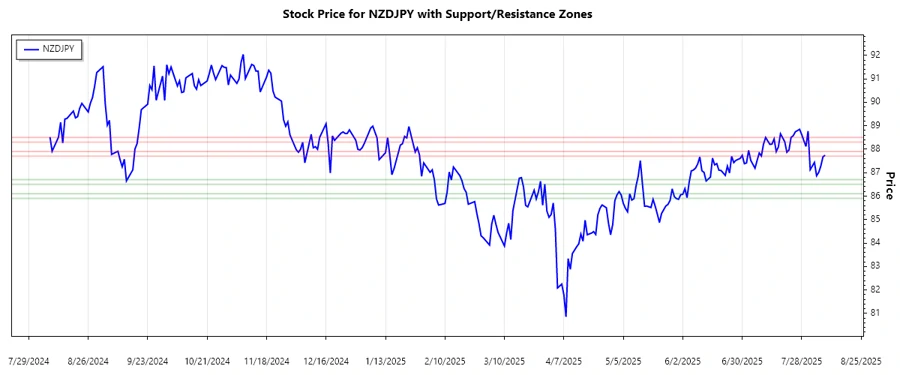
The analysis of the NZDJPY currency pair reveals a nuanced market trend with noticeable fluctuations in recent months. The key moving average indicators, EMA20 and EMA50, provide insight into this volatility. Recent trading sessions have shown shifts that could influence investor sentiment, demanding careful attention. A detailed technical analysis follows to outline the primary trend and critical support and resistance zones.
Trend Analysis
| Date | Close Price | Trend |
|---|---|---|
| 2025-08-08 | 87.744 | ▼ Downtrend |
| 2025-08-07 | 87.673 | ▼ Downtrend |
| 2025-08-06 | 87.284 | ▼ Downtrend |
| 2025-08-05 | 87.011 | ▼ Downtrend |
| 2025-08-04 | 86.867 | ▼ Downtrend |
| 2025-08-03 | 87.437 | ▼ Downtrend |
| 2025-08-01 | 87.127 | ▼ Downtrend |
Examining the EMA20 and EMA50 indicates a sustained bearish trend over the observed period. The persistent downtrend signals investor caution, potentially adjusting to external economic conditions.
Support and Resistance
| Zone Type | From | To |
|---|---|---|
| Support 1 | 85.90 | 86.10 |
| Support 2 | 86.50 | 86.70 |
| Resistance 1 | 87.70 | 87.90 |
| Resistance 2 | 88.30 | 88.50 |
The current price level is within the established support zone, indicating potential for a stabilization or rebound if this support holds against selling pressure.
Conclusion
Overall, NZDJPY is experiencing a downward trend, which may indicate potential risk for investors unless there is a significant rebound. The support zones identified present possible stabilization points for the currency pair, which traders should carefully monitor. These levels could, in turn, act as triggers for further market movement based on external economic influences and market sentiment. Thus, maintaining a vigilant approach remains key for investors trading the currency.
Smart Data Insight
Master the Perfect Entry & Exit for this Stock
Don't leave your profits to chance. Historically, this stock follows specific seasonal patterns that institutional traders use to maximize returns.
- ✅ Identify the "Golden Buying Window"
- ✅ Avoid high-risk correction cycles
- ✅ Backtested data from the last 20+ years