
June 21, 2026 a 05:08 am

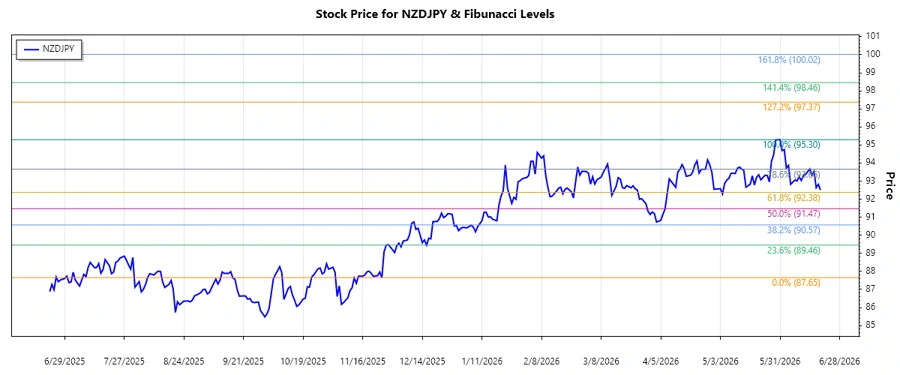
NZDJPY: Fibonacci Analysis
The NZDJPY currency pairing has shown notable volatility in the analyzed period. Recent trends indicate a movement that financial analysts should monitor closely. The fluctuations within the pair are of specific interest due to shifting economic indicators in Japan and New Zealand.
Fibonacci Analysis
The trend from April to June 2026 reveals a significant upward momentum. By leveraging the Fibonacci retracement tool on this dominant trend, we can gain insights into potential support and resistance levels. This information is particularly useful for trading strategies focusing on retracements.
| Trend Information | Details | ||||||||||||
|---|---|---|---|---|---|---|---|---|---|---|---|---|---|
| Start Date | 2025-11-25 | ||||||||||||
| End Date | 2026-05-31 | ||||||||||||
| High Price | $95.296 on 2026-05-31 | ||||||||||||
| Low Price | $87.654 on 2025-11-25 | ||||||||||||
| Fibonacci Levels |
|
||||||||||||
| Current Price Level | The current price is around $92.507, indicating it is within the 0.5 Fibonacci retracement level. | ||||||||||||
| Technical Interpretation | This level implies a potential support area from which the price might rebound if the bullish trend continues. |
Conclusion
In summary, the NZDJPY analysis shows a robust upward trend with a likely support level around the 0.5 Fibonacci retracement mark. Investors should be cautious of any breaks below this level, which may signal further downside or possible trend reversals. Maintaining a close watch on economic developments in New Zealand and Japan will be crucial for predicting future price movements. The current trend holds promise for bullish investors while suggesting that a reversal could provide opportunities for shorting.
Smart Data Insight
Master the Perfect Entry & Exit for this Stock
Don't leave your profits to chance. Historically, this stock follows specific seasonal patterns that institutional traders use to maximize returns.
- ✅ Identify the "Golden Buying Window"
- ✅ Avoid high-risk correction cycles
- ✅ Backtested data from the last 20+ years