June 02, 2026 a 05:08 am

NZDJPY: Fibonacci Analysis
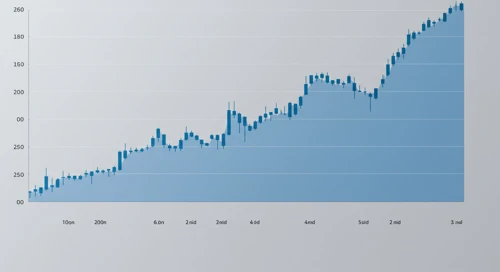
The NZDJPY currency pair exhibits a strong upward trend over the past few months, reaching significant resistance levels. As both the New Zealand and Japanese economies face unique challenges, the fluctuations in this currency pair are driven by varying interest rates and economic policies. Traders and analysts are keenly monitoring the pair for any signs of retracement or continuation of the current trend.
Fibonacci Analysis
| Aspect | Details |
|---|---|
| Start Date | 2025-11-25 |
| End Date | 2026-06-02 |
| High Point | 95.296 on 2026-05-31 |
| Low Point | 87.654 on 2025-11-25 |
| Fibonacci Levels |
|
| Current Price Position | In retracement zone at 92.958. Currently near the 0.5 level. |
| Technical Interpretation | The current price positioning near the 0.5 Fibonacci retracement level suggests potential support, indicating a possible continuation of the uptrend if supported by fundamentals. |
Conclusion
In conclusion, the NZDJPY presents a compelling case for a technical retracement analysis, sitting at a pivotal Fibonacci level. Investors and analysts should stay vigilant of economic indicators from New Zealand and Japan that might tip the balance. While the upward trend suggests attractive opportunities, underlying risks such as abrupt economic policy changes could shift trajectory. Monitoring market reactions around these key levels can provide valuable insight into potential price actions.
Smart Data Insight
Master the Perfect Entry & Exit for this Stock
Don't leave your profits to chance. Historically, this stock follows specific seasonal patterns that institutional traders use to maximize returns.
- ✅ Identify the "Golden Buying Window"
- ✅ Avoid high-risk correction cycles
- ✅ Backtested data from the last 20+ years