May 11, 2026 a 05:08 am
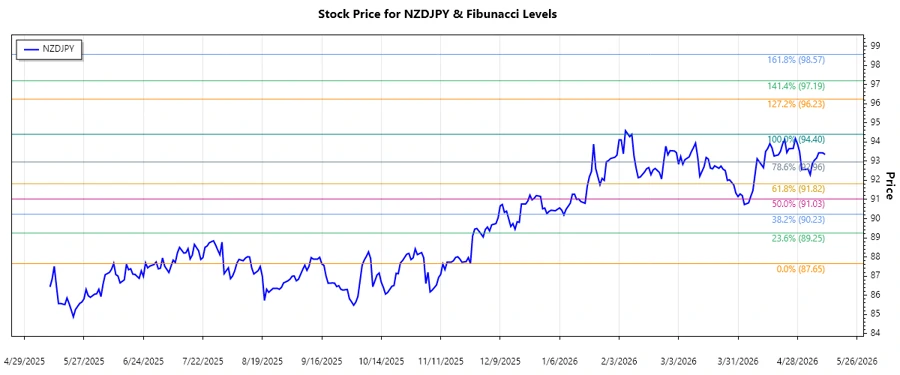
NZDJPY: Fibonacci Analysis
The NZDJPY pair has shown significant fluctuations in the recent months, reflecting global economic shifts and market sentiment. Traders have been closely watching the pair as it reacts to broader market trends and central bank policies. With a history of volatility, the current pattern suggests potential reversal or continuation opportunities for traders.
Fibonacci Analysis
| Detail | Information |
|---|---|
| Trend Dates | 2025-11-25 to 2026-05-11 |
| Highest Price & Date | 94.4 on 2026-02-09 |
| Lowest Price & Date | 87.654 on 2025-11-25 |
Fibonacci Levels
| Level | Price |
|---|---|
| 0.236 | 89.774 |
| 0.382 | 91.044 |
| 0.5 | 91.987 |
| 0.618 | 92.930 |
| 0.786 | 94.274 |
Currently, the price is around 93.345, indicating it is in the retracement zone of 0.618. This suggests a potential support area where the price might stabilize before deciding its next move.
With the price in this zone, traders should watch for confirmation of support around this level for potential long opportunities or a break below for a bearish signal.
Conclusion
The NZDJPY currency pair is at a crucial juncture, testing key Fibonacci retracement levels. The recent uptrend shows signs of consolidation, which could either lead to a continuation or a reversal. Analysts should closely monitor the current price action around the 0.618 level, as it could provide valuable insights into potential future movements. While the opportunity for reward exists if the support holds, there is also a risk of further decline if the price breaks this level. Understanding these dynamics is essential for traders looking to capitalize on the NZDJPY’s price action. Overall, this analysis highlights both opportunities and dangers inherent in the current market context.
Smart Data Insight
Master the Perfect Entry & Exit for this Stock
Don't leave your profits to chance. Historically, this stock follows specific seasonal patterns that institutional traders use to maximize returns.
- ✅ Identify the "Golden Buying Window"
- ✅ Avoid high-risk correction cycles
- ✅ Backtested data from the last 20+ years