December 15, 2025 a 05:08 am
NZDJPY: Fibonacci Analysis
NZDJPY shows a dominant upward trend in recent months, reflecting increased global confidence in the New Zealand economy. The pair has benefited from a favorable risk environment, but faces potential headwinds from fluctuating commodity prices. Understanding key retracement levels is crucial for traders navigating this dynamic landscape.
Fibonacci Analysis
| Detail | Information |
|---|---|
| Start Date of Trend | 2025-04-08 |
| End Date of Trend | 2025-12-15 |
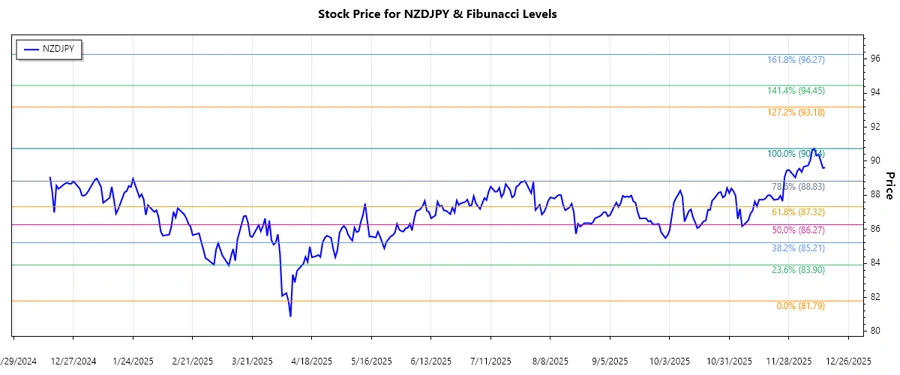
| High Point (Price and Date) | 90.741 on 2025-12-10 |
| Low Point (Price and Date) | 81.791 on 2025-04-07 |
| Fibonacci Level | Price Level |
|---|---|
| 0.236 | 83.832 |
| 0.382 | 85.442 |
| 0.5 | 86.266 |
| 0.618 | 87.090 |
| 0.786 | 88.325 |
The current price is in the 0.5 retracement zone, suggesting potential support and possible continuation of the uptrend.
The current technical outlook suggests that the 0.5 Fibonacci level is acting as a robust support. If held, buyers could push prices to retest recent highs, providing strategic entry points for long positions.
Conclusion
The NZDJPY highlights a clear upward momentum with opportunities for traders as technical levels unfold. Holding above the 0.5 retracement could reinforce the bullish sentiment, inviting more buy-side interest. However, traders should remain cautious of macroeconomic factors such as commodity price volatility that could impact the pair. Monitoring these levels can provide strategic insights for both short-term and long-term trades.