October 28, 2025 a 05:08 am
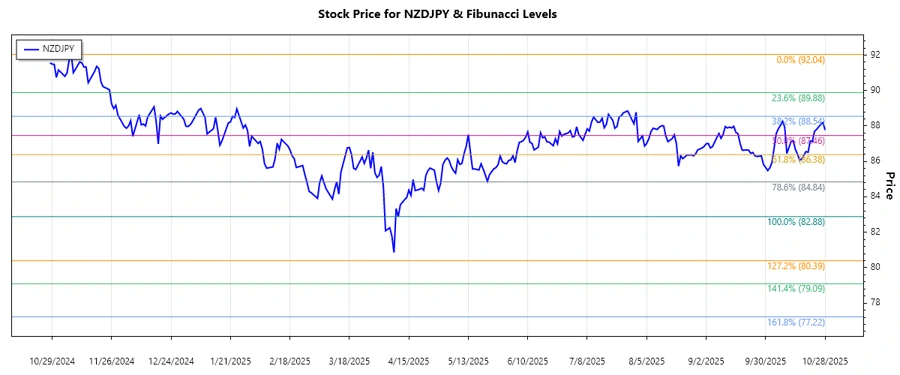
NZDJPY: Fibonacci Analysis
The NZDJPY currency pair has experienced a significant downtrend over the past several months, presenting both challenges and opportunities for traders. The recent decline may position the pair for a potential reversal, pending market conditions and geopolitical influences. As the pair approaches key Fibonacci retracement levels, investors are looking for signals of stabilization or further decline.
Fibonacci Analysis
| Attribute | Details |
|---|---|
| Start Date | 2024-11-08 |
| End Date | 2025-10-28 |
| High Price & Date | 92.04 on 2024-11-07 |
| Low Price & Date | 82.882 on 2025-04-10 |
| 0.236 Level | 85.563 |
| 0.382 Level | 87.149 |
| 0.5 Level | 87.961 |
| 0.618 Level | 88.773 |
| 0.786 Level | 89.947 |
| Current Price | 87.77 |
| Retracement Zone | 0.5 |
| Interpretation | The current price is in the 0.5 retracement zone, suggesting a possible resistance level. A breakthrough here could indicate upward potential, while rejection might lead to further declines. |
Conclusion
The NZDJPY currency pair is currently in a critical phase, with its position in the 0.5 Fibonacci retracement zone. This could provide resistance, and any move above this level might signal bullish tendencies, offering a buy opportunity. However, failure to break this level might indicate continued downside pressure. Analysts should weigh these technical indicators against the backdrop of broader economic signals and geopolitical factors impacting the currency pair.
Smart Data Insight
Master the Perfect Entry & Exit for this Stock
Don't leave your profits to chance. Historically, this stock follows specific seasonal patterns that institutional traders use to maximize returns.
- ✅ Identify the "Golden Buying Window"
- ✅ Avoid high-risk correction cycles
- ✅ Backtested data from the last 20+ years