September 21, 2025 a 05:08 am
NZDJPY: Fibonacci Analysis
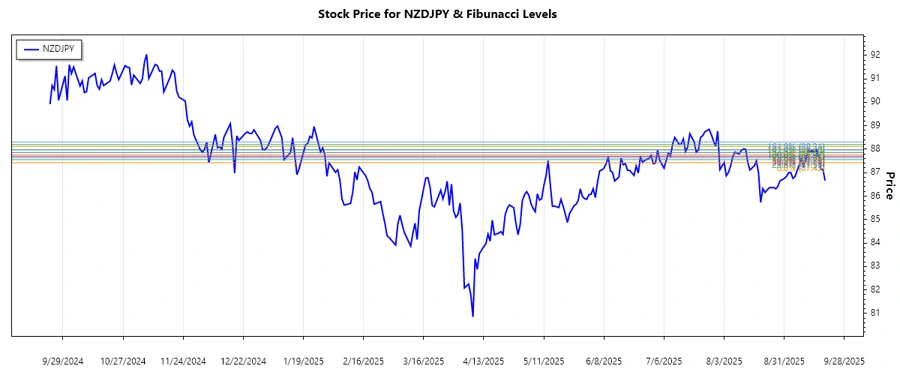
The NZDJPY currency pair has shown significant fluctuations over the past months. An overall upward trend was recently observed, indicating potential strength in the New Zealand dollar against the Japanese yen. Understanding these movements can help traders make informed decisions. Utilizing technical tools like Fibonacci Retracement provides insights into potential support and resistance levels.
Fibonacci Analysis
| Details | Information |
|---|---|
| Trend Start Date | 2025-08-14 |
| Trend End Date | 2025-09-16 |
| High (Date & Price) | 2025-09-15 & 87.971 |
| Low (Date & Price) | 2025-08-14 & 87.426 |
| Fibonacci Levels |
0.236: 87.82 0.382: 87.75 0.5: 87.70 0.618: 87.65 0.786: 87.56 |
| Current Retracement Zone | 0.382 |
| Interpretation | The current price is within the 0.382 retracement level, suggesting potential support. If the price holds, a rebound could be likely. |
Conclusion
The analysis of NZDJPY indicates a persisting upward trend, suggesting potential gains for those long on the New Zealand dollar. However, the presence in the 0.382 Fibonacci retracement zone demands caution. If the price breaks this support, a further decline might ensue. Traders are advised to monitor macroeconomic indicators that could influence this currency pair. This setup offers lucrative opportunities, yet also brings risk of reversals, emphasizing the importance of stop-loss strategies. The trend's continuation can result in new highs; however, market volatility could present challenges.
Smart Data Insight
Master the Perfect Entry & Exit for this Stock
Don't leave your profits to chance. Historically, this stock follows specific seasonal patterns that institutional traders use to maximize returns.
- ✅ Identify the "Golden Buying Window"
- ✅ Avoid high-risk correction cycles
- ✅ Backtested data from the last 20+ years