
July 26, 2026 a 04:28 amjson
NZDCHF: Trend and Support & Resistance Analysis
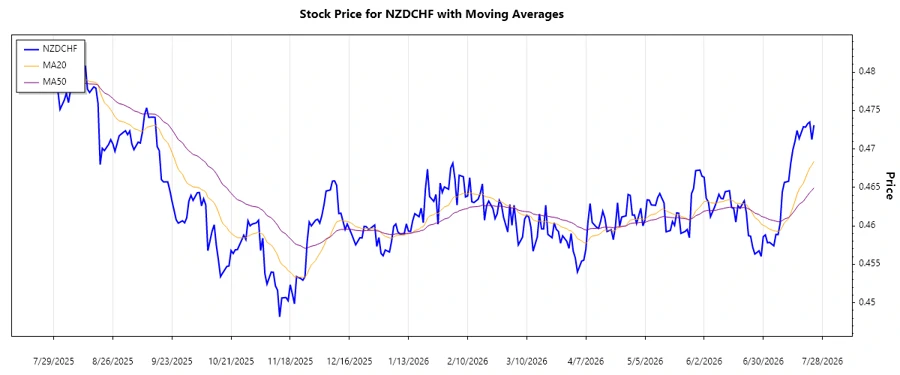
The NZDCHF currency pair has shown a notable upward trend in recent months, allowing investors to potentially capitalize on bullish momentum. Careful observation of support and resistance levels is important in identifying optimal entry and exit points. The EMA analysis further supports the presence of a consistent upward trend, although fluctuations should not be ignored.
Trend Analysis
The recent trend analysis of the NZDCHF currency pair reveals a clear upward trend over the last few months. The calculation of EMA20 and EMA50 indicates that the EMA20 is greater than the EMA50, confirming a bullish movement.
| Date | Closing Price | Trend |
|---|---|---|
| 2026-07-24 | 0.4731 | ▲ |
| 2026-07-23 | 0.47121 | ▲ |
| 2026-07-22 | 0.4735 | ▲ |
| 2026-07-21 | 0.47328 | ▲ |
| 2026-07-20 | 0.47283 | ▲ |
| 2026-07-19 | 0.47289 | ▲ |
| 2026-07-17 | 0.47136 | ▲ |
The consistent upward trajectory suggests a strong buying interest, making it an attractive currency for investors aiming to join the uptrend.
Support and Resistance
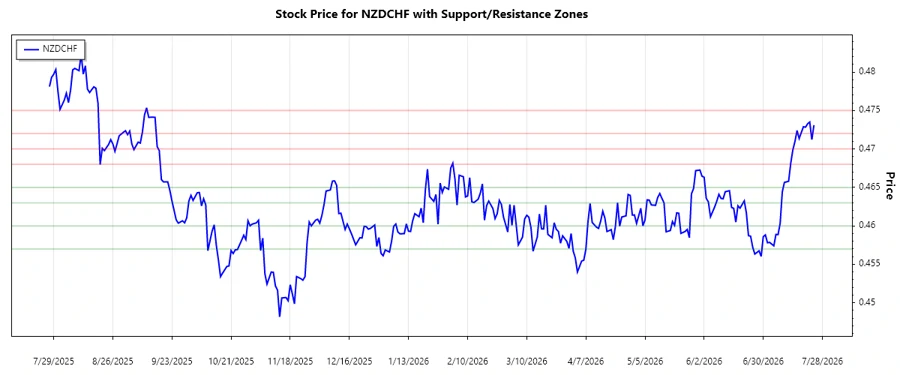
Analyzing the historical price data for NZDCHF reveals significant support and resistance levels crucial for trading strategies. Key support zones are identified between 0.457 and 0.460, alongside 0.463 and 0.465. Resistance zones are pegged at 0.468 to 0.470 and 0.472 to 0.475.
| Zone | From | To | Direction |
|---|---|---|---|
| Support Zone 1 | 0.457 | 0.460 | ▼ |
| Support Zone 2 | 0.463 | 0.465 | ▼ |
| Resistance Zone 1 | 0.468 | 0.470 | ▲ |
| Resistance Zone 2 | 0.472 | 0.475 | ▲ |
The current price is hovering around the upper resistance zone, suggesting potential breakout opportunities or a reversal if it fails to close above this level.
Conclusion
The NZDCHF currency pair exhibits a strong upward trend, with favorable technical indicators and clearly defined support and resistance levels. This pattern indicates possible growth opportunities for investors. Nevertheless, caution is advised as the currency approaches critical resistance levels, with increased volatility anticipated. Monitoring these price points closely can aid investors in making informed trading decisions while minimizing potential risks associated with sudden market reversals.
Smart Data Insight
Master the Perfect Entry & Exit for this Stock
Don't leave your profits to chance. Historically, this stock follows specific seasonal patterns that institutional traders use to maximize returns.
- ✅ Identify the "Golden Buying Window"
- ✅ Avoid high-risk correction cycles
- ✅ Backtested data from the last 20+ years