August 02, 2025 a 04:28 am
NZDCHF: Trend and Support & Resistance Analysis
The NZDCHF has shown significant movement over recent months, with the pair experiencing fluctuations influenced by various economic factors. Understanding these trends through technical analysis, especially focusing on EMAs, can provide a clearer picture of its trajectory. While the pair has faced pressures and resistances, identifying reliable support and resistance zones is crucial. This analysis provides a detailed dive into the recent trend patterns and potential zones for support and resistance.
Trend Analysis
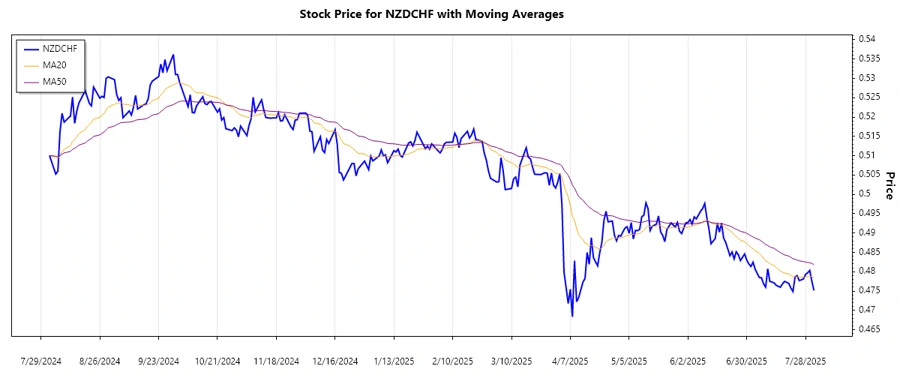
The detailed analysis of NZDCHF reveals fluctuating trends over the past months. The EMA calculations play a crucial role in determining the current trend direction.
| Date | Close Price | Trend |
|---|---|---|
| 2025-08-01 | 0.47515 | ▼ Abwärtstrend |
| 2025-07-31 | 0.47754 | ▼ Abwärtstrend |
| 2025-07-30 | 0.48033 | ▲ Aufwärtstrend |
| 2025-07-29 | 0.47971 | ▲ Aufwärtstrend |
| 2025-07-28 | 0.47932 | ⚖️ Seitwärtstrend |
| 2025-07-27 | 0.47811 | ⚖️ Seitwärtstrend |
| 2025-07-25 | 0.4777 | ⚖️ Seitwärtstrend |
The current moving averages suggest a downward momentum, indicating potential bearish pressures in the market.
Support and Resistance
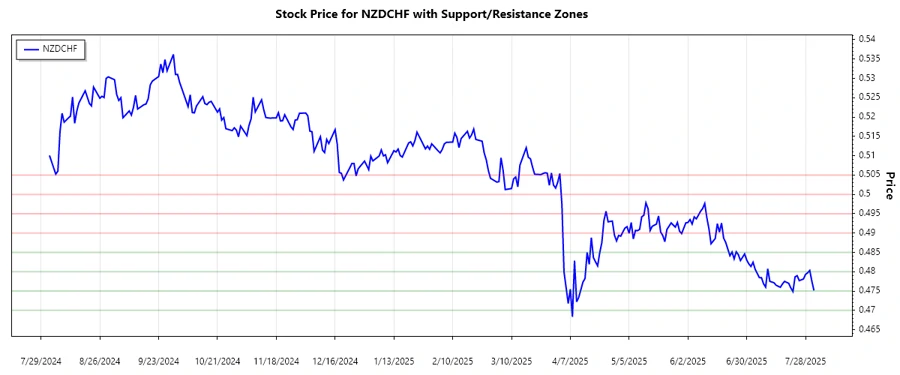
Identifying support and resistance zones provides insight into the potential boundaries of market trends.
| Zone Type | From | To |
|---|---|---|
| Support | 0.470 | 0.475 |
| Support | 0.480 | 0.485 |
| Resistance | 0.490 | 0.495 |
| Resistance | 0.500 | 0.505 |
The current close price is approaching a support zone which could potentially act as a price floor.
Conclusion
The NZDCHF currency pair displays a predominantly downward trend based on the EMA analysis, suggesting a bearish market sentiment. Key support zones are being tested, which might result in some rebound or continued pressure towards those levels. The well-defined resistance zones indicate price caps that could contain any bullish momentum temporarily. Analysts should remain vigilant of breakout scenarios that may alter the current direction. While current movements provide opportunities for short positions, traders should prepare for potential volatility.
Smart Data Insight
Master the Perfect Entry & Exit for this Stock
Don't leave your profits to chance. Historically, this stock follows specific seasonal patterns that institutional traders use to maximize returns.
- ✅ Identify the "Golden Buying Window"
- ✅ Avoid high-risk correction cycles
- ✅ Backtested data from the last 20+ years