
July 11, 2026 a 05:08 am
NZDCHF: Fibonacci Analysis
The NZDCHF currency pair has shown a volatile trend over the past months, indicating significant price movements. A close examination reveals the recent downtrend, which suggests a potential for reversal or continuation based on key technical levels. This analysis aims to identify these levels and provide insights into the pair's future price actions.
Fibonacci Analysis
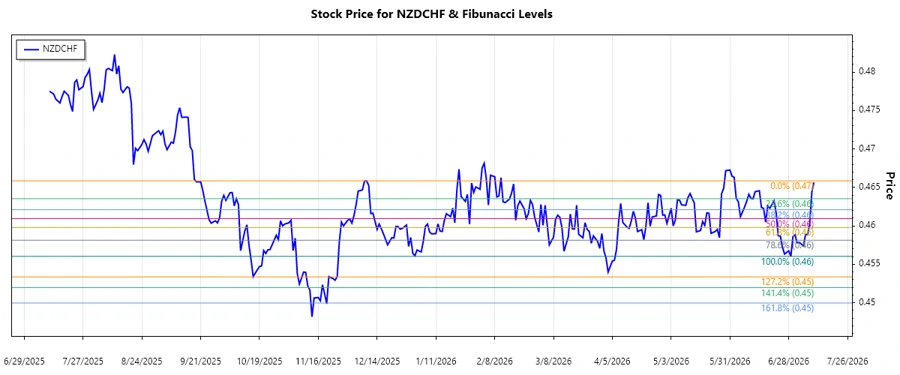
An in-depth analysis of the NZDCHF reveals a recent downtrend, marked by lower highs and lower lows. Using the high and low points of this trend, we calculated the Fibonacci retracement levels to identify potential areas of support and resistance.
| Data Points | Details |
|---|---|
| Trend Start Date | 2025-12-09 |
| Trend End Date | 2026-07-10 |
| High Price & Date | 0.46585 on 2025-12-09 |
| Low Price & Date | 0.45603 on 2026-06-29 |
Based on the identified high and low, the following Fibonacci retracement levels are calculated:
| Fibonacci Level | Price |
|---|---|
| 0.236 | 0.45814 |
| 0.382 | 0.45947 |
| 0.5 | 0.46094 |
| 0.618 | 0.46241 |
| 0.786 | 0.46401 |
Currently, the price is at 0.46565, which is above the Fibonacci retracement levels calculated, indicating a potential breakout scenario.
The current price positioning above all Fibonacci levels signifies technical resistance overcoming and supports a possible upward trend continuation.
Conclusion
In conclusion, the NZDCHF pair's previous downtrend, combined with the recent breach above Fibonacci retracement levels, showcases a bullish potential for the pair. However, this may also attract selling at resistance levels formed historically. Analysts should watch for confirmation of trend continuation or signals of reversal, which could provide lucrative trading opportunities. The chances for profitable trade setups are higher given the nearing price movement around pivotal technical points.
Smart Data Insight
Master the Perfect Entry & Exit for this Stock
Don't leave your profits to chance. Historically, this stock follows specific seasonal patterns that institutional traders use to maximize returns.
- ✅ Identify the "Golden Buying Window"
- ✅ Avoid high-risk correction cycles
- ✅ Backtested data from the last 20+ years