April 30, 2026 a 05:08 am
NZDCHF: Fibonacci Analysis
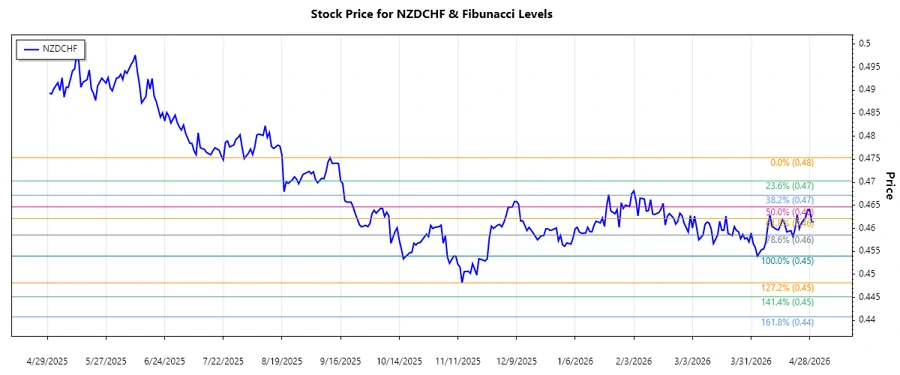
The NZDCHF currency pair has shown notable fluctuations amid global economic activities. As a currency pair representing the economies of New Zealand and Switzerland, it is influenced by factors such as interest rates, trade balances, and geopolitical events. In recent months, the trend has been predominantly downward, reflecting a stronger Swiss Franc amid economic uncertainties. This report provides a technical analysis using the Fibonacci Retracement tool to gauge potential future movements.
Fibonacci Analysis
| Parameter | Value |
|---|---|
| Trend Start Date | 2026-04-30 |
| Trend End Date | 2025-09-11 |
| High Price | 0.47536 (2025-09-11) |
| Low Price | 0.454 (2026-04-03) |
| Fibonacci Level | Price |
|---|---|
| 0.236 | 0.4591 |
| 0.382 | 0.46221 |
| 0.5 | 0.46468 |
| 0.618 | 0.46715 |
| 0.786 | 0.47061 |
The current price as of the last trade date is 0.46145. The price is currently within the 0.236 Fibonacci retracement zone, which suggests a potential support level.
This retracement could indicate a short-term recovery before the continuation of the dominant downtrend, or a reversal depending on upcoming economic data influencing the currency pair.
Conclusion
In summary, the NZDCHF has been experiencing a downward momentum, reflecting a more robust Swiss economic performance and global risk aversion factors. Traders should be cautious as the currency pair approaches critical support levels. While retracement at the 0.236 level suggests potential for short-term recovery, prevailing economic conditions still favor a continuation of the downtrend. Analysts must keep an eye on macroeconomic indicators that could sway the pair significantly.