March 23, 2026 a 05:08 am
NZDCHF: Fibonacci Analysis
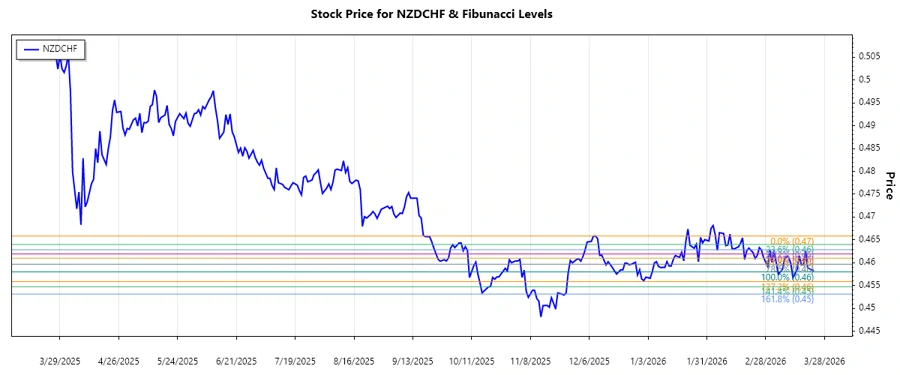
The NZDCHF currency pair reflects the economic interplay between New Zealand and Switzerland. Recent trends indicate a noticeable shift influenced by global economic factors. Understanding these shifts is crucial for making informed trading decisions. Through technical analysis, we aim to identify potential support and resistance levels using Fibonacci tools.
Fibonacci Analysis
| Parameter | Details | ||||||||||||
|---|---|---|---|---|---|---|---|---|---|---|---|---|---|
| Analyzed Trend Dates | 2025-12-09 to 2026-03-23 | ||||||||||||
| High Point | 0.46585 on 2025-12-09 | ||||||||||||
| Low Point | 0.458 on 2026-01-05 | ||||||||||||
| Fibonacci Levels |
|
||||||||||||
| Current Retracement Zone | 0.5 | ||||||||||||
| Technical Interpretation | The NZDCHF is currently in the 0.5 retracement zone, potentially indicating a support level. |
This chart illustrates how NZDCHF prices are moving in relation to key Fibonacci levels.
Conclusion
The NZDCHF currency pair has shown a dominant downtrend since December 2025. Key Fibonacci levels provide potential support, notably at the 0.5 level. Traders should watch for any price action around these retracement levels, as breaking below could signal further decline. However, should support hold, a rebound might be anticipated. Thus, monitoring these levels is crucial for strategic decision-making.