December 14, 2025 a 05:08 am
NZDCHF: Fibonacci Analysis
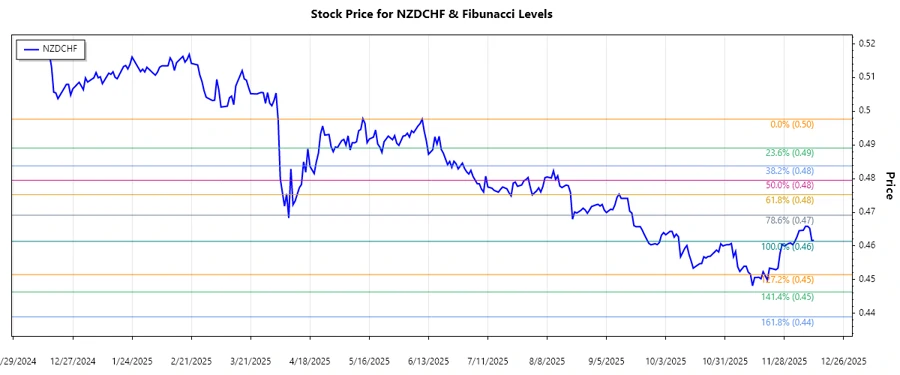
The NZDCHF currency pair is navigating through a significant downtrend in the past months. The rate has seen substantial fluctuations, reflecting broader economic pressures and shifts in market sentiment. As global uncertainties continue to loom, the NZD demonstrates a potential for further declines against the CHF unless supportive macroeconomic data provides a counteracting force.
Fibonacci Analysis
The NZDCHF exchange rate has exhibited a consistent downtrend from June 2025 to December 2025. The Fibonacci retracement analysis identifies key levels that may act as possible support or resistance points.
| Parameter | Details |
|---|---|
| Trend Period | 2025-06-10 to 2025-12-12 |
| High Point | 0.49764 on 2025-06-10 |
| Low Point | 0.46136 on 2025-12-03 |
| Fibonacci Levels |
|
| Current Price | 0.46165, near the low point |
| Current Retracement Zone | None; the current price is below the 0.236 level |
| Technical Interpretation | The current positioning suggests potential continuation of the downtrend unless a positive reversal signal emerges. Key resistance is expected around the 0.236 and 0.382 levels. |
Conclusion
The technical analysis highlights the persistent weakness in the NZD against the CHF, underscored by a pronounced downtrend. While retracement levels offer potential resistance, the market sentiment remains fragile. Traders should approach with caution, recognizing both the possibility of further declines and the opportunity for rebounds should conditions shift in favor of the NZD. Continuous monitoring of macroeconomic indicators will be crucial for informed decision-making.