December 05, 2025 a 05:08 am

NZDCHF: Fibonacci Analysis
The NZDCHF pair has demonstrated notable volatility over the recent months, influenced by both the economic policies of New Zealand and Switzerland. While the New Zealand Dollar has been affected by commodity prices and global trade dynamics, the Swiss Franc remains driven by its role as a safe haven. Recent trends indicate a prominent bearish movement, presenting opportunities for traders to capitalize on significant Fibonacci retracement levels.
Fibonacci Analysis
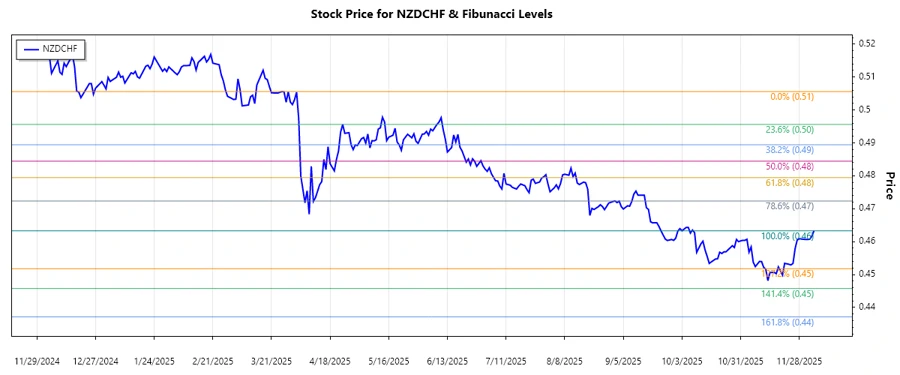
The NZDCHF exchange rate has recently experienced a significant downtrend, with its peak at 0.50559 on March 26, 2025, and its lowest point on December 5, 2025, at 0.46329. Utilizing these extrema to perform a Fibonacci retracement analysis provides vital insight into potential support and resistance levels.
| Trend Start Date | Trend End Date | High Price | Low Price |
|---|---|---|---|
| 2025-03-26 | 2025-12-05 | 0.50559 | 0.46329 |
Fibonacci Levels
| Level | Price | Description |
|---|---|---|
| 0.236 | 0.47311 | Potential initial resistance |
| 0.382 | 0.48138 | Significant resistance level |
| 0.5 | 0.48444 | Major mid-point resistance |
| 0.618 | 0.48750 | Last significant resistance |
| 0.786 | 0.49367 | Highly resistant level |
The current price of 0.46329 indicates that the NZDCHF is sitting below the 0.236 retracement level, suggesting no significant retracement yet. This may indicate strong bearish momentum, signifying potential ongoing weakness.
From a technical perspective, the levels identified may provide future resistance areas should the price attempt any upside corrections. The trade within these levels could provide delicate trade setups for bears targeting further downtrend continuation.
Conclusion
The sustained downward movement in the NZDCHF pair reflects ongoing economic pressures and market sentiment favoring the Swiss Franc. While the current trend suggests continued bearish momentum, any fundamental changes in the global economic landscape could alter this trajectory. It is crucial for analysts to monitor both economic data releases and geopolitical developments that may impact these currencies. The Fibonacci analysis provides a framework for traders to identify potential inflection points and strategically plan their trades. Despite risks inherent in forex trading, leveraging strategic levels such as those identified can offer meaningful opportunities.