September 20, 2025 a 05:08 am**NZDCHF: Fibonacci Analysis**
The NZDCHF currency pair has shown notable movements in recent months, influenced by both domestic economic indicators and global market dynamics. Historically, the NZD has been sensitive to changes in commodity prices, while the CHF often serves as a safe haven in times of economic uncertainty. This pair's performance can thus reflect broader market sentiment and risk appetite shifts.
Fibonacci Analysis
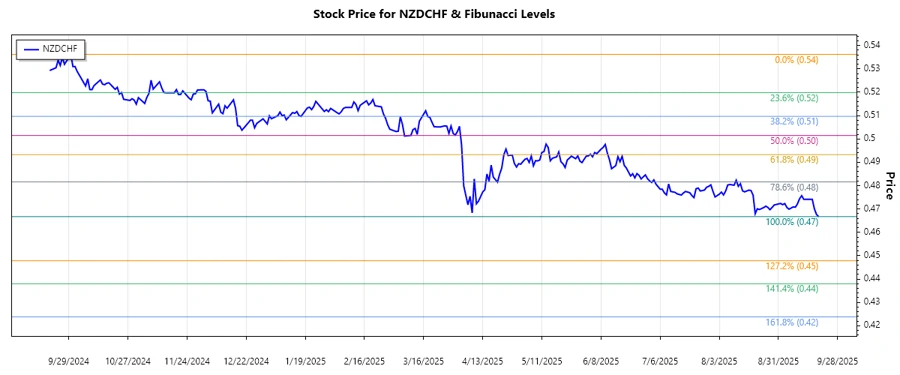
After analyzing the provided data, a downtrend has been observed. The high was on 2024-09-30 with a price of 0.5362, and the low occurred on 2025-09-19 with a price of 0.46673. Based on this trend, we've calculated the Fibonacci retracement levels. Currently, the price is hovering around 0.4701, placing it in the 0.236 retracement zone.
| Detail | Value |
|---|---|
| Trend Start Date | 2024-09-30 |
| Trend End Date | 2025-09-19 |
| High Price & Date | 0.5362 on 2024-09-30 |
| Low Price & Date | 0.46673 on 2025-09-19 |
| Fibonacci Level | Price Level |
|---|---|
| 0.236 | 0.48576 |
| 0.382 | 0.49877 |
| 0.5 | 0.50148 |
| 0.618 | 0.51334 |
| 0.786 | 0.52865 |
The current price is in the 0.236 Fibonacci retracement zone. This zone serves as an early retracement level, where reversals can often be seen. If the price rebounds in this zone, it can indicate a temporary pause or reversal in the dominant trend.
Conclusion
The NZDCHF has shown a clear downtrend from September 2024 to September 2025. Currently sitting at a 0.236 retracement, there's potential for a minor correction or reversal. However, if the downtrend momentum resumes, lower price levels could still be tested. Investors should consider the external economic environment, particularly monetary policy shifts from the Reserve Bank of New Zealand and Swiss economic data. An upside breakout above significant retracement levels may signal a trend reversal, offering long opportunities. Conversely, persistence below these levels may suggest continuation chances for short positions.
Smart Data Insight
Master the Perfect Entry & Exit for this Stock
Don't leave your profits to chance. Historically, this stock follows specific seasonal patterns that institutional traders use to maximize returns.
- ✅ Identify the "Golden Buying Window"
- ✅ Avoid high-risk correction cycles
- ✅ Backtested data from the last 20+ years