May 23, 2025 a 05:08 am
NZDCHF: Fibonacci Analysis
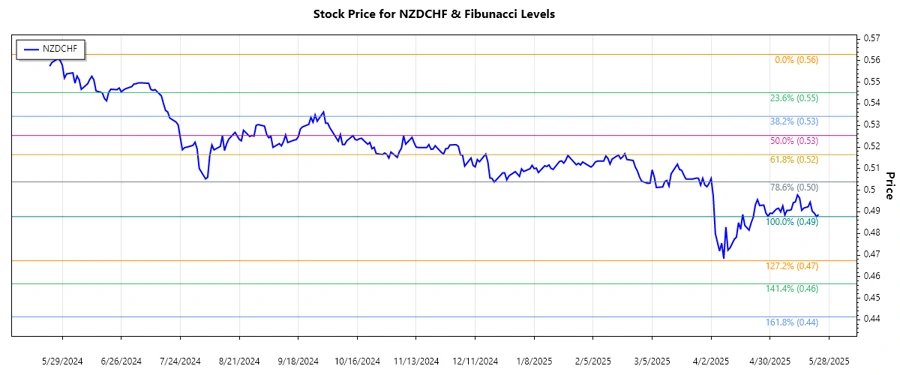
The NZDCHF currency pair has demonstrated notable fluctuations over the past months, adjusting to various economic pressures from New Zealand and Switzerland. Recently, the pair has predominantly followed a downward trajectory, reflecting broader macroeconomic trends. Despite this, the NZDCHF remains a topic of interest for traders looking for potential reversals or continuations of the current trend.
Fibonacci Analysis
| Item | Value |
|---|---|
| Start Date of Trend | 2024-05-23 |
| End Date of Trend | 2025-05-23 |
| High Price Point (Date) | 0.56288 (2024-05-27) |
| Low Price Point (Date) | 0.48777 (2025-05-22) |
| Fibonacci Level 0.236 | 0.50655 |
| Fibonacci Level 0.382 | 0.51692 |
| Fibonacci Level 0.5 | 0.52532 |
| Fibonacci Level 0.618 | 0.53371 |
| Fibonacci Level 0.786 | 0.54458 |
| Current Price Retracement Zone | 0.382 |
| Technical Interpretation | The current price resides within the 0.382 retracement zone, suggesting potential resistance or consolidation at this level before further movement. |
Conclusion
Overall, the NZDCHF pair has been in a downward trend recently, reflecting economic pressure on the New Zealand Dollar against the Swiss Franc. The analyzed Fibonacci retracement levels provide critical insights into potential zones of support and resistance. As the current price occupies the 0.382 retracement level, traders should watch for signs of reversal or continuation. This level might serve as a temporary resistance, offering opportunities for strategic trades. Analysts must evaluate broader economic indicators to forecast future movements effectively.
Smart Data Insight
Master the Perfect Entry & Exit for this Stock
Don't leave your profits to chance. Historically, this stock follows specific seasonal patterns that institutional traders use to maximize returns.
- ✅ Identify the "Golden Buying Window"
- ✅ Avoid high-risk correction cycles
- ✅ Backtested data from the last 20+ years