May 12, 2025 a 05:08 am
NZDCHF: Fibonacci Analysis
The NZDCHF currency pair's recent performance highlights significant volatility, influenced by economic events from both New Zealand and Switzerland. A notable downward trend has been observed, providing opportunities for potential retracements. Traders should remain alert to macroeconomic releases that could influence future price directions.
Fibonacci Analysis
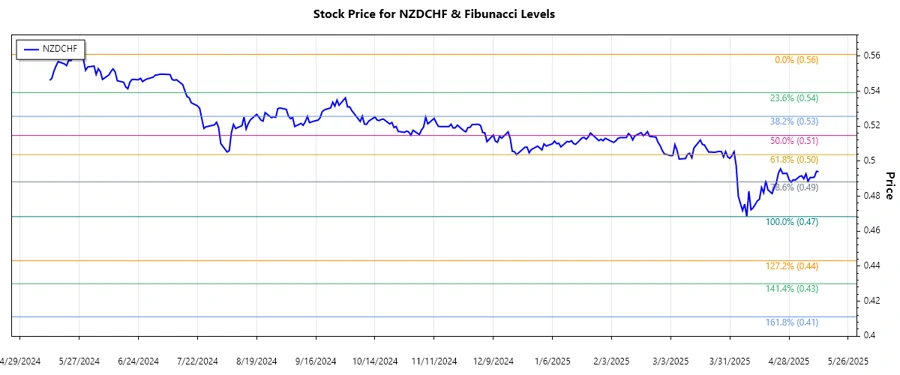
The analysis of NZDCHF from July 2024 to May 2025 indicates a strong downward trend. Key Fibonacci Retracement levels have been calculated from the high of 0.56102 on May 27, 2024, to a low of 0.46832 on April 8, 2025. Currently, the price appears to be within the 0.618 retracement level, which could act as a resistance, indicating a possible reversal or consolidation phase.
| Analysis Details | Information |
|---|---|
| Start Date | 2024-05-27 |
| End Date | 2025-04-08 |
| High Price and Date | 0.56102 (2024-05-27) |
| Low Price and Date | 0.46832 (2025-04-08) |
| Fibonacci Level | Price Level |
|---|---|
| 0.236 | 0.49143 |
| 0.382 | 0.50588 |
| 0.500 | 0.51467 |
| 0.618 | 0.52346 |
| 0.786 | 0.53653 |
The current price of 0.49401 lies within the 0.236 retracement level, suggesting a strong resistance area that may challenge future upward movements. Analysts should observe this level closely to anticipate potential price reversals.
Conclusion
The NZDCHF's observed downtrend aligns with broader geopolitical and economic factors, presenting both challenging and opportunistic scenarios for traders. While the currency pair currently engages in a retracement phase, monitors of trend changes are essential for anticipating possible support or resistance.
Smart Data Insight
Master the Perfect Entry & Exit for this Stock
Don't leave your profits to chance. Historically, this stock follows specific seasonal patterns that institutional traders use to maximize returns.
- ✅ Identify the "Golden Buying Window"
- ✅ Avoid high-risk correction cycles
- ✅ Backtested data from the last 20+ years