
July 18, 2026 a 04:28 am
NZDCAD: Trend and Support & Resistance Analysis
The NZDCAD currency pair presents intriguing opportunities for investors. Recent data suggest fluctuations within defined support and resistance zones, making it a volatile yet potentially rewarding choice for traders. Understanding the trends and zones in play could be crucial for making informed decisions in this market. Notably, the short-term trend appears to be influenced by prevailing market conditions and recent economic data. Keep an eye on key support levels for potential entry points.
Trend Analysis
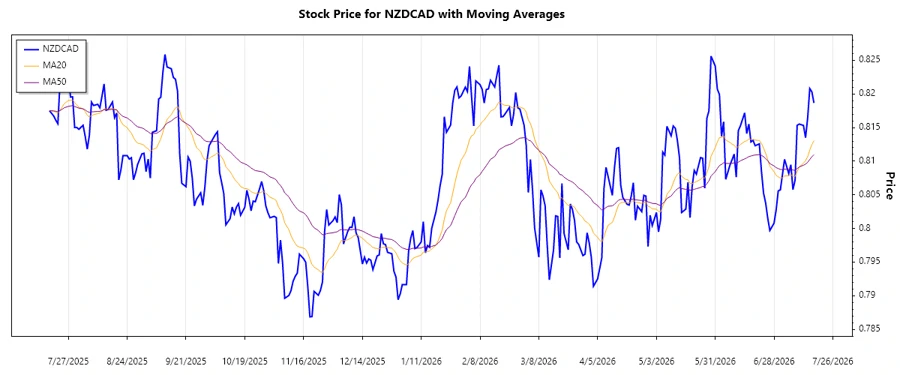
The recent trend analysis of the NZDCAD currency shows a fluctuating pattern over the past months. Using the EMA (Exponential Moving Average) indicators, specifically the EMA20 and EMA50, we observe the following trend patterns. A crossover analysis indicates that EMA20 is slightly greater than EMA50, signaling a ▲ uptrend. A detailed examination of the last seven days is presented in the table below.
| Date | Closing Price | Trend |
|---|---|---|
| 2026-07-17 | 0.81866 | ▲ Uptrend |
| 2026-07-16 | 0.82032 | ▲ Uptrend |
| 2026-07-15 | 0.8208 | ▲ Uptrend |
| 2026-07-14 | 0.81643 | ▲ Uptrend |
| 2026-07-13 | 0.8135 | ▲ Uptrend |
| 2026-07-12 | 0.81532 | ▲ Uptrend |
| 2026-07-10 | 0.81552 | ▲ Uptrend |
From a technical perspective, the consistent uptrend over the last few days indicates a positive sentiment towards the NZDCAD currency pair. Traders should consider this trend when formulating strategies.
Support and Resistance
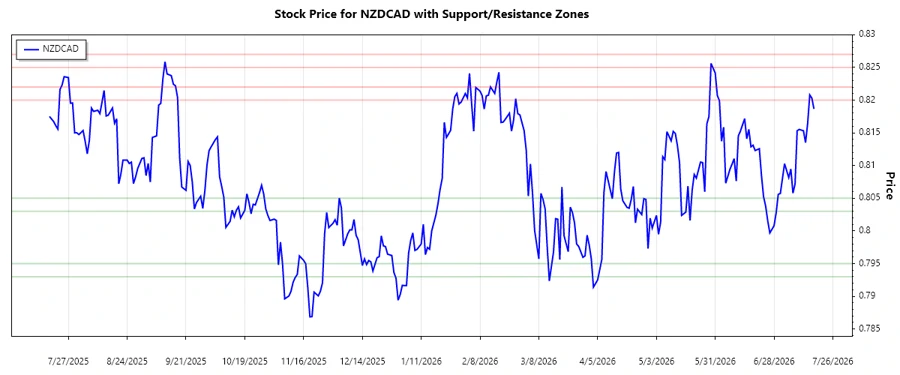
An analysis of support and resistance zones reveals valuable information for traders. We have identified the two significant support and resistance zones based on recent closing prices. These zones are critical as they provide potential entry and exit points for traders.
| Zone Type | From | To |
|---|---|---|
| Support 1 | 0.803 | 0.805 |
| Support 2 | 0.793 | 0.795 |
| Resistance 1 | 0.820 | 0.822 |
| Resistance 2 | 0.825 | 0.827 |
Currently, the closing price is approaching the first resistance zone, signaling a potential reversal or breakout situation. Traders should monitor these levels closely for any significant price action.
Conclusion
The NZDCAD currency pair exhibits a promising upward trend with defined support and resistance zones. Traders should be cautious of the resistance zones as the price approaches them, which may imply a reversal or continuation of the current trend. The identified support levels can serve as strategic entry points should the price pull back. The potential for volatility remains, necessitating vigilant monitoring and analysis. Investors must weigh the risks against the opportunities in positioning within this dynamic market.
Smart Data Insight
Master the Perfect Entry & Exit for this Stock
Don't leave your profits to chance. Historically, this stock follows specific seasonal patterns that institutional traders use to maximize returns.
- ✅ Identify the "Golden Buying Window"
- ✅ Avoid high-risk correction cycles
- ✅ Backtested data from the last 20+ years