
June 18, 2026 a 04:28 am

NZDCAD: Trend and Support & Resistance Analysis
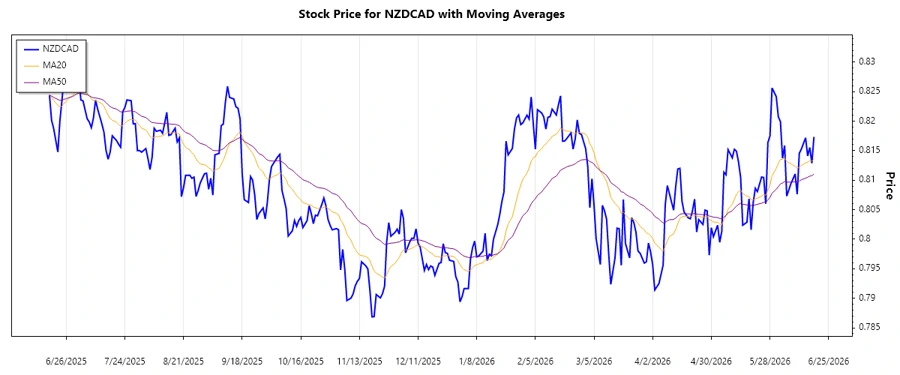
The analysis of NZDCAD based on recent data indicates a potential upward trend. The calculated EMAs suggest a bullish sentiment as the EMA20 is greater than the EMA50, confirming an uptrend. Key support and resistance zones are identified to guide potential trading strategies. The current price dynamics suggest a trading range, providing opportunities for both short-term and long-term positions.
Trend Analysis
Upon analyzing the NZDCAD historical data, it becomes evident that the currency pair is currently exhibiting an upward trend. This is confirmed by the calculated exponential moving averages (EMA) where the EMA20 surpasses the EMA50. The table below showcases the price trend over the last week.
| Date | Close Price | Trend |
|---|---|---|
| 2026-06-18 | 0.81734 | ▲ Uptrend |
| 2026-06-17 | 0.81286 | ▲ Uptrend |
| 2026-06-16 | 0.81553 | ▲ Uptrend |
| 2026-06-15 | 0.81410 | ▲ Uptrend |
| 2026-06-14 | 0.81718 | ▲ Uptrend |
| 2026-06-12 | 0.81527 | ▲ Uptrend |
| 2026-06-11 | 0.81455 | ▲ Uptrend |
The consistent bullish signals suggest an opportunity to explore bullish positions in the short term. However, vigilance is necessary given potential resistance levels.
Support and Resistance
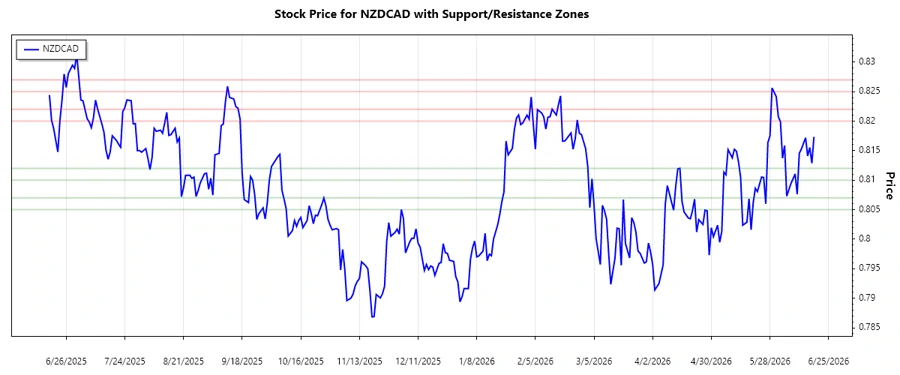
Current price action analysis reveals key support and resistance levels. Based on recent closing prices, two significant support zones and resistance zones have been identified.
| Zone | From | To |
|---|---|---|
| Support Zone 1 | 0.81000 | 0.81200 |
| Support Zone 2 | 0.80500 | 0.80700 |
| Resistance Zone 1 | 0.82000 | 0.82200 |
| Resistance Zone 2 | 0.82500 | 0.82700 |
The current price is approaching the resistance zone, suggesting potential hurdles for further upside unless there is substantial momentum.
Traders should monitor these levels closely, as a breach could indicate a continuation or reversal of the current trend.
Conclusion
The NZDCAD exhibits an interesting dynamic characterized by a prevailing upward trend, indicated by EMA measurements. The currency pair is testing resistance territories which may either solidify a bullish continuation or induce a market pullback. For technical traders, prioritizing support levels could mitigate risks while the momentum remains intact. As always, a keen observation of fundamental market drivers is key to navigating potential volatility and seizing profitable trading opportunities.
Smart Data Insight
Master the Perfect Entry & Exit for this Stock
Don't leave your profits to chance. Historically, this stock follows specific seasonal patterns that institutional traders use to maximize returns.
- ✅ Identify the "Golden Buying Window"
- ✅ Avoid high-risk correction cycles
- ✅ Backtested data from the last 20+ years