February 04, 2026 a 04:28 am
NZDCAD: Trend and Support & Resistance Analysis
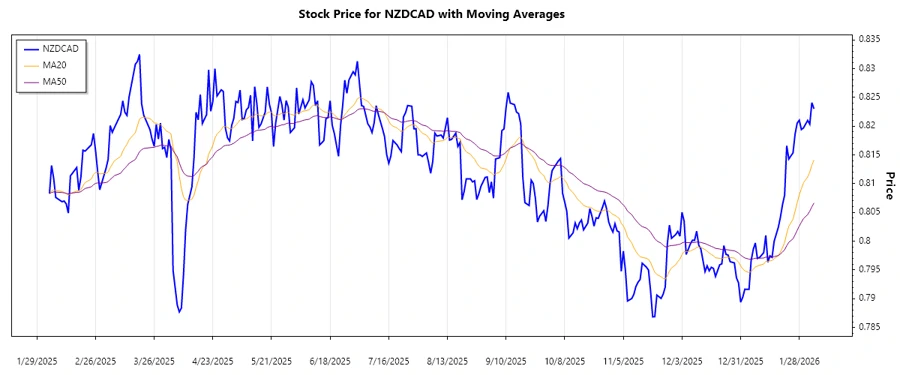
The NZDCAD currency pair has demonstrated notable price movements in recent months. This analysis will focus on identifying the current trend, as well as key support and resistance zones. By examining the exponential moving averages and historical price data, we gain insights into potential future price directions.
Trend Analysis
Based on recent data, the trend appears to be upward as evident from the relationship between the EMA20 and EMA50 over the past weeks. The EMA20 has consistently remained above EMA50, indicating a bullish sentiment. Here is a summary of data from the last 7 days:
| Date | Closing Price | Trend |
|---|---|---|
| 2026-02-04 | 0.82302 | ▲ Uptrend |
| 2026-02-03 | 0.82409 | ▲ Uptrend |
| 2026-02-02 | 0.82035 | ▲ Uptrend |
| 2026-02-01 | 0.82101 | ▲ Uptrend |
| 2026-01-30 | 0.81970 | ▲ Uptrend |
| 2026-01-29 | 0.81941 | ▲ Uptrend |
| 2026-01-28 | 0.82104 | ▲ Uptrend |
The consistent upward movement in recent closing prices reinforces the interpretation of a solid uptrend.
Support and Resistance
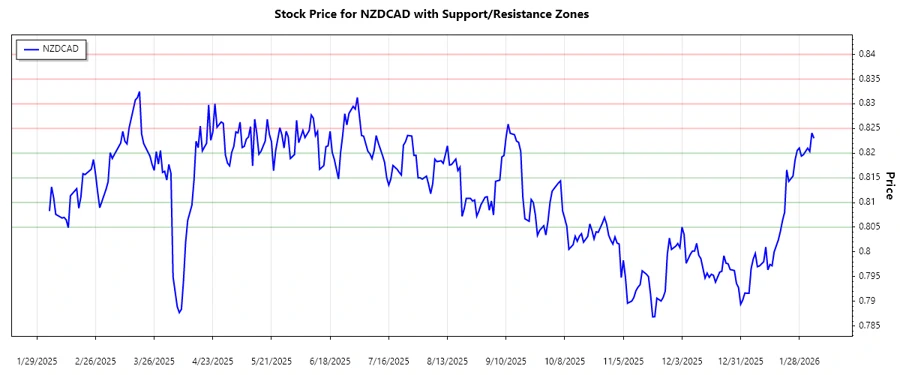
Identifying the support and resistance zones provides clues to the price levels where trading activity may potentially increase. The established support zones lie between 0.8050 to 0.8100 and 0.8150 to 0.8200, while resistance zones are observed between 0.8250 to 0.8300 and 0.8350 to 0.8400. Currently, the price is flirting around the lower resistance zone, which may act as a hurdle for further advancements.
| Zone Type | Zone Range | Zone Indicator |
|---|---|---|
| Support 1 | 0.8050 - 0.8100 | ▼ |
| Support 2 | 0.8150 - 0.8200 | ▼ |
| Resistance 1 | 0.8250 - 0.8300 | ▲ |
| Resistance 2 | 0.8350 - 0.8400 | ▲ |
As the current price approaches the lower resistance zone, this area may influence upcoming market behavior, with a potential pullback or a breakout signifying future movements.
Conclusion
Given the current upward trend and proximity to resistance levels, the NZDCAD pair exhibits potential for both opportunities and risks. Traders should watch for any breakout above resistance levels or reversals signaling corrections. Maintaining awareness of these zones helps manage trading strategies effectively. The continued analysis provides essential insights, especially as the market tests these critical levels.