September 08, 2025 a 04:28 am
NZDCAD: Trend and Support & Resistance Analysis
The recent performance of the NZDCAD currency pair has shown some fluctuations, yet it has managed to maintain a relatively stable range. With recent data analyzed, it's evident that the pair is navigating around key technical zones, offering traders potential opportunities. The presence of nearby support and resistance levels can guide decision-making for both short-term and long-term traders. This analysis delves into the current trends and key levels that may influence future movements.
Trend Analysis
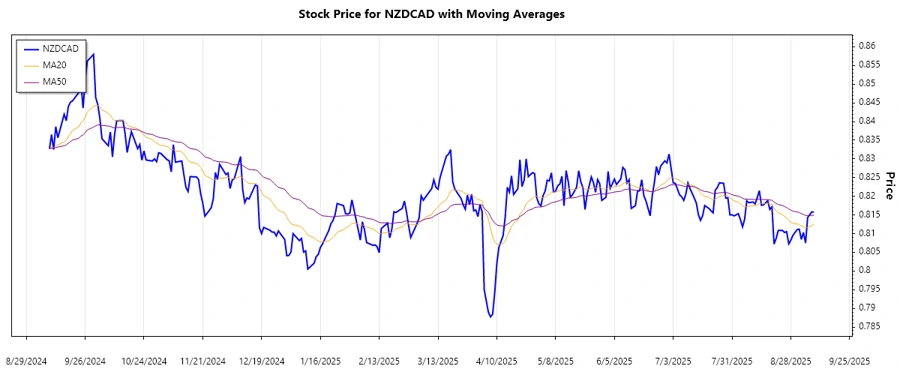
The daily price data for NZDCAD has been thoroughly analyzed to discern the prevailing trend. Calculations of the Exponential Moving Averages (EMA) for 20 and 50 days reveal the following: For much of the recent period, the EMA20 has dipped below the EMA50, indicative of a ▼ downtrend. Notably, however, there are sparks of potential recovery as the latest figures suggest a possible transition.
| Date | Close Price | Trend |
|---|---|---|
| 2025-09-08 | 0.81574 | ▼ |
| 2025-09-07 | 0.81582 | ▼ |
| 2025-09-05 | 0.8143 | ▼ |
| 2025-09-04 | 0.80748 | ▼ |
| 2025-09-03 | 0.81032 | ▼ |
| 2025-09-02 | 0.80845 | ▼ |
| 2025-09-01 | 0.81118 | ▼ |
The continued alignment of the moving averages supports a cautious outlook. Currently, there is no significant indication of a reversal, demanding close attention to any emerging bullish signals.
Support and Resistance
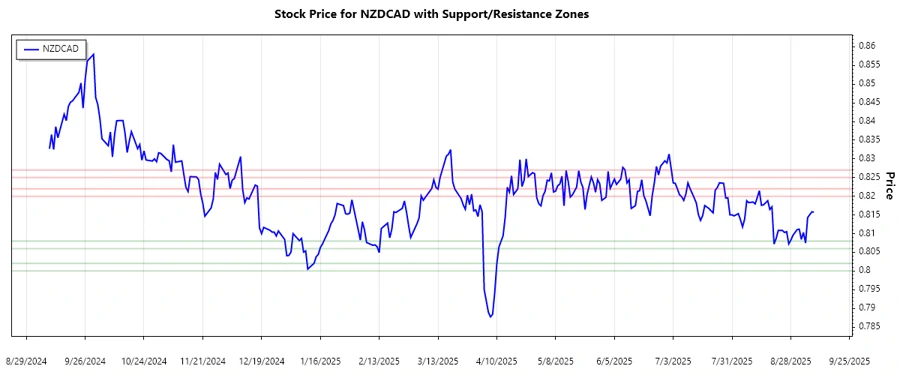
Identifying support and resistance levels is crucial for making informed trading decisions. For NZDCAD, the following zones have been calculated: The primary support zones are at the price levels 0.806 - 0.808 and 0.800 - 0.802, while the resistance zones stand at 0.820 - 0.822 and 0.825 - 0.827.
| Zone | From | To |
|---|---|---|
| Support 1 | 0.806 | 0.808 |
| Support 2 | 0.800 | 0.802 |
| Resistance 1 | 0.820 | 0.822 |
| Resistance 2 | 0.825 | 0.827 |
The current close price hovers just above the primary support zone, indicating traders should look for potential buy reversals or breakdowns as cues for their next moves.
Conclusion
The NZDCAD currency pair is currently in a downward trend, reflecting broader market dynamics. Risks include potential further declines if support levels are breached. However, any sustainable bounce from these levels may offer trading opportunities for those seeking to capitalize on volatility. For analysts, maintaining a vigilant watch on indicator crossovers and price movements at key levels can provide crucial insights into future trends.