March 03, 2026 a 05:08 am
NZDCAD: Fibonacci Analysis
NZDCAD has shown complex price movements over the observed period, reflecting both macroeconomic trends in New Zealand and Canada. Recent market dynamics and interest rate policies have contributed to the currency's volatility, creating both opportunities and risks for traders. The Fibonacci analysis reveals critical insights into potential support and resistance levels.
Fibonacci Analysis
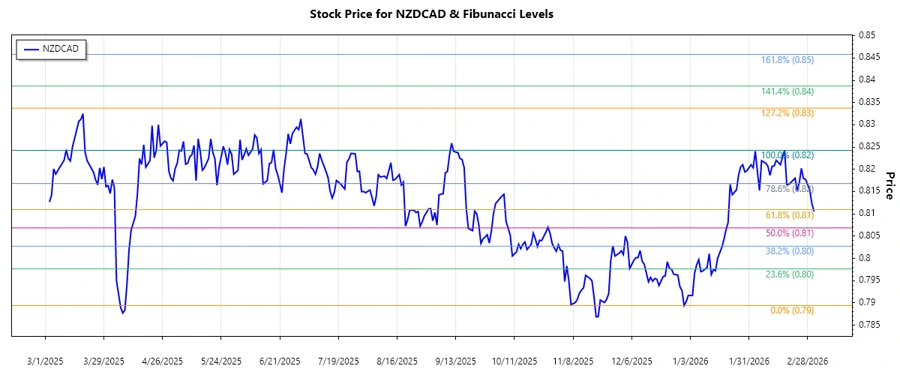
The recent months have presented a clear upward trend for the NZDCAD, starting from a significant low point in January 2026 and peaking in early March 2026. This trend offers insights into key price levels based on Fibonacci retracement.
| Aspect | Details |
|---|---|
| Trend Start Date | 2026-01-01 |
| Trend End Date | 2026-03-03 |
| High Point | 0.82427 (2026-02-17) |
| Low Point | 0.7894 (2025-12-31) |
| Fibonacci Levels |
0.236 - 0.79616 0.382 - 0.80503 0.5 - 0.806835 0.618 - 0.81864 0.786 - 0.82053 |
| Current Price | 0.81055 (as of 2026-03-03) |
| Current Retracement Zone | 0.618 |
| Interpretation | The current price suggests it's within the 0.618 retracement level. This traditionally indicates a solid support area in an upward trend scenario. |
Conclusion
The NZDCAD has shown an upward trajectory with a prominent high at 0.82427. Currently, the price rests within the critical 0.618 Fibonacci retracement level, suggesting a strong support zone that may give rise to future bullish movements. However, any breach below this level could imply potential downside risks, bringing the next lower Fibonacci level into play. Traders should monitor fundamental economic data closely, as market sentiment and macroeconomic events could significantly influence future price movements. Careful attention should be given to key resistance levels indicated by higher Fibonacci retracement levels.