September 27, 2025 a 05:08 am
NZDCAD: Fibonacci Analysis
The NZDCAD currency pair has experienced significant fluctuations over recent months, demonstrating both volatility and potential opportunities for traders. This pair's movements often reflect broader economic conditions in New Zealand and Canada, influenced by global commodity prices and economic policies. Understanding the technical aspects of this currency pair, such as Fibonacci retracement levels, can provide valuable insights for making informed trading decisions.
Fibonacci Analysis
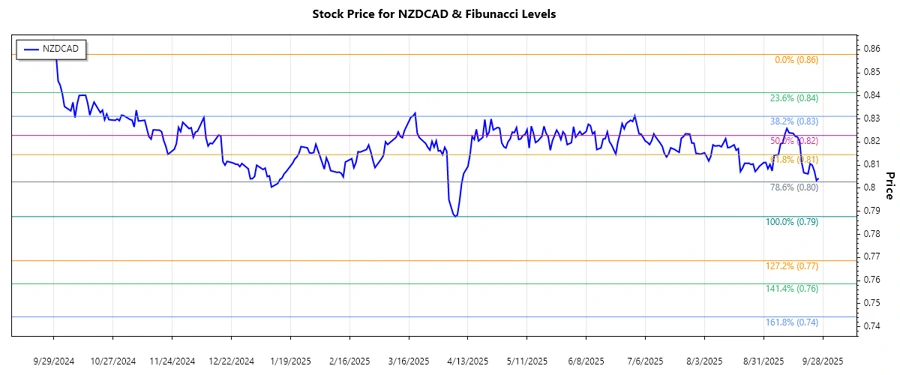
Upon analyzing the historical data of the NZDCAD currency pair, a dominant downward trend is visible. The data spans from April 2025 to September 2025, where the highest recorded price was 0.85797 on 2024-09-30, and the lowest was 0.78771 on 2025-04-07. Based on these points, we have calculated the following Fibonacci retracement levels, indicating potential reversal zones.
| Retracement Level | Price Level |
|---|---|
| 0.236 | 0.80598 |
| 0.382 | 0.81743 |
| 0.500 | 0.82444 |
| 0.618 | 0.83145 |
| 0.786 | 0.84230 |
The current price of NZDCAD is approximately 0.80434, placing it near the 0.236 retracement level, suggesting a potential reversal could be imminent. If a reversal occurs, these levels may act as support or resistance points.
Conclusion
In conclusion, the NZDCAD currency pair has shown a strong downward trend over the past months. The currency pair's movement around the 0.236 Fibonacci retracement level suggests that traders should monitor for potential reversals. While there's a chance for recovery, further downward pressure could still dominate. Analysts must consider global economic indicators and commodity price changes affecting both New Zealand and Canada's economies. Maintaining vigilance on key retracement levels could guide strategic entry and exit decisions.
Smart Data Insight
Master the Perfect Entry & Exit for this Stock
Don't leave your profits to chance. Historically, this stock follows specific seasonal patterns that institutional traders use to maximize returns.
- ✅ Identify the "Golden Buying Window"
- ✅ Avoid high-risk correction cycles
- ✅ Backtested data from the last 20+ years