August 13, 2025 a 05:08 am
NZDCAD: Fibonacci Analysis
The NZDCAD currency pair has shown some fluctuations over the past few months. Observing the recent movements, the pair has been influenced by several economic factors affecting both New Zealand and Canada. As investors keep a close watch on monetary policies and economic performance of these countries, analyzing the technical trends can provide clear guidance for trading strategies.
Fibonacci Analysis
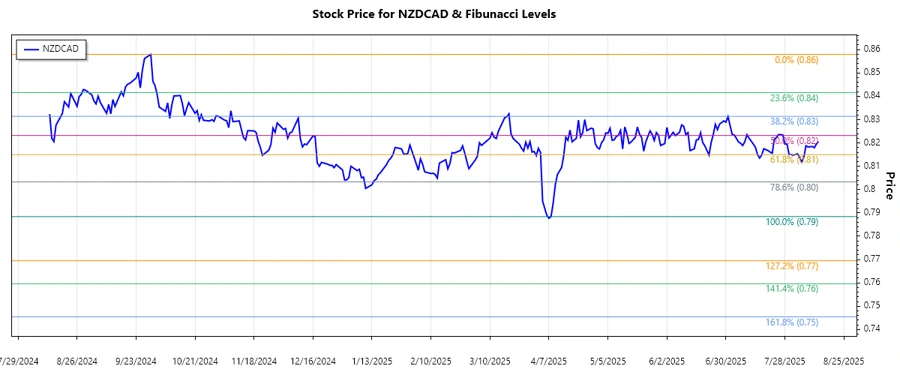
The recent NZDCAD price data indicates a dominant downward trend beginning in late August. By examining the price movements, we observe significant highs and lows used to assess potential reversal levels using Fibonacci Retracement. Trend started in September and currently shows volatile behavior.
| Details | Information |
|---|---|
| Start Date | 2024-09-30 |
| End Date | 2025-08-13 |
| High Point (Price & Date) | 0.85797 on 2024-09-30 |
| Low Point (Price & Date) | 0.7884 on 2025-04-08 |
| Fibonacci Level | Price Level |
|---|---|
| 0.236 | 0.80407 |
| 0.382 | 0.81919 |
| 0.5 | 0.82318 |
| 0.618 | 0.83829 |
| 0.786 | 0.84756 |
The current price indicates that NZDCAD is trading around the 0.382 retracement level. This suggests a potential resistance area where further price consolidation may occur.
The technical interpretation indicates potential support and reversal opportunities which traders should monitor closely to exploit market volatility.
Conclusion
In conclusion, while the NZDCAD pair shows an overall bearish trajectory, the retracement levels offer potential zones to identify price reversals. Traders should be cautious about geopolitical and economic drivers that could alter the current trend. A bullish reversal at the current levels could offer substantial trading opportunities. However, continued downward pressure may lead to a test of lower support levels. It's prudent to watch key indicators and maintain risk management strategies.
Smart Data Insight
Master the Perfect Entry & Exit for this Stock
Don't leave your profits to chance. Historically, this stock follows specific seasonal patterns that institutional traders use to maximize returns.
- ✅ Identify the "Golden Buying Window"
- ✅ Avoid high-risk correction cycles
- ✅ Backtested data from the last 20+ years