June 02, 2025 a 05:08 am

NZDCAD: Fibonacci Analysis
The NZDCAD currency pair has shown notable fluctuations over the observed period. Influenced by economic factors from New Zealand and Canada, the exchange rate has experienced dynamic changes. Recent data points to a significant downward trend, impacting the trading strategies of forex traders and investors.
Fibonacci Analysis
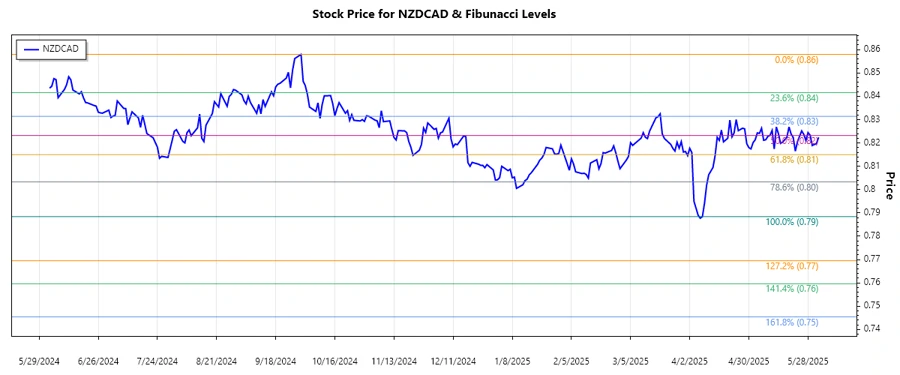
The analysis of the NZDCAD currency pair indicates a prominent downward trend starting from late September 2024 through June 2025. The high of this trend was noted on September 30, 2024, and the low was recorded on April 9, 2025. Based on the highest price of 0.85797 and the lowest price of 0.7884, Fibonacci retracement levels have been calculated.
| Data | Details |
|---|---|
| Trend Start Date | 2024-09-30 |
| Trend End Date | 2025-06-02 |
| High Point (Price & Date) | 0.85797 on 2024-09-30 |
| Low Point (Price & Date) | 0.7884 on 2025-04-09 |
| Fibonacci 0.236 Level | 0.80598 |
| Fibonacci 0.382 Level | 0.81717 |
| Fibonacci 0.5 Level | 0.82319 |
| Fibonacci 0.618 Level | 0.82921 |
| Fibonacci 0.786 Level | 0.83802 |
| Current Price Analysis | The current price of 0.8224 is within the 0.5 Fibonacci retracement level at 0.82319, suggesting potential resistance at this level. |
| Technical Interpretation | The 0.5 level often serves as a significant point of interest, acting as a potential resistance. A breakout above this level may indicate a reversal or continuation of a bearish trend. |
Conclusion
The NZDCAD analysis reveals a clear downward trend with significant implications for traders. The recent position near the 0.5 Fibonacci level highlights potential resistance, suggesting a cautious approach. Traders should watch for a break in either direction to assess further opportunities. However, geopolitical and economic factors may introduce volatility, requiring ongoing analysis. The retracement levels provide a technical framework for market participants, with the potential for strategic trading decisions.
Smart Data Insight
Master the Perfect Entry & Exit for this Stock
Don't leave your profits to chance. Historically, this stock follows specific seasonal patterns that institutional traders use to maximize returns.
- ✅ Identify the "Golden Buying Window"
- ✅ Avoid high-risk correction cycles
- ✅ Backtested data from the last 20+ years