
June 27, 2026 a 08:00 am

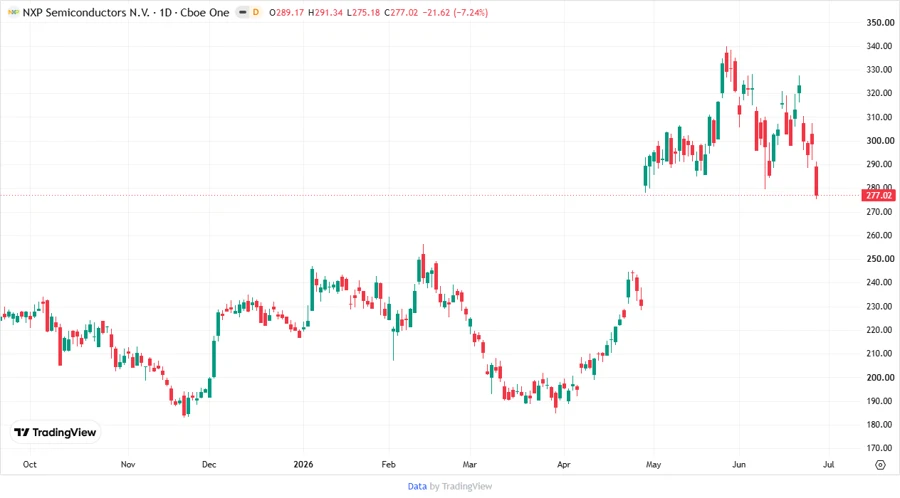
NXPI: Fundamental Ratio Analysis - NXP Semiconductors N.V.
NXP Semiconductors N.V. presents a solid position in the semiconductor industry with its extensive array of products. The company's innovation particularly in wireless connectivity and IoT positions it for sustained growth. However, investors should be aware of market volatility and supply chain challenges inherent to the sector.
Fundamental Rating
The fundamental analysis shows a promising overall score with strong returns on equity and assets. However, the debt to equity ratio is a potential area of concern.
| Category | Score | Visualization |
|---|---|---|
| Discounted Cash Flow | 3 | |
| Return on Equity | 5 | |
| Return on Assets | 5 | |
| Debt to Equity | 1 | |
| Price to Earnings | 3 | |
| Price to Book | 2 |
Historical Rating
The historical data indicates stability in scores, with no significant changes over time.
| Date | Overall | DCF | ROE | ROA | D/E | P/E | P/B |
|---|---|---|---|---|---|---|---|
| 2026-06-25 | 3 | 3 | 5 | 5 | 1 | 3 | 2 |
| No Date | 0 | 3 | 5 | 5 | 1 | 3 | 2 |
Analyst Price Targets
Analyst estimates show a favorable consensus, with a median target price suggesting positive growth potential.
| High | Low | Median | Consensus |
|---|---|---|---|
| 295 | 188 | 240 | 242.6 |
Analyst Sentiment
The analyst sentiment reflects a strong buy inclination, suggesting market confidence in NXP's performance.
| Recommendation | Count | Visualization |
|---|---|---|
| Strong Buy | 0 | |
| Buy | 32 | |
| Hold | 12 | |
| Sell | 2 | |
| Strong Sell | 0 |
Conclusion
NXP Semiconductors N.V. shows robust potential in the semiconductor market with its diverse product portfolio. The company's steady fundamentals and positive analyst ratings indicate a stable growth trajectory. However, potential investors should remain mindful of sector-specific risks such as market volatility and supply chain disruptions. Overall, NXPI represents a compelling investment option with calculated risks.
Smart Data Insight
Master the Perfect Entry & Exit for this Stock
Don't leave your profits to chance. Historically, this stock follows specific seasonal patterns that institutional traders use to maximize returns.
- ✅ Identify the "Golden Buying Window"
- ✅ Avoid high-risk correction cycles
- ✅ Backtested data from the last 20+ years