October 10, 2025 a 10:15 am

NXPI: Fibonacci Analysis - NXP Semiconductors N.V.
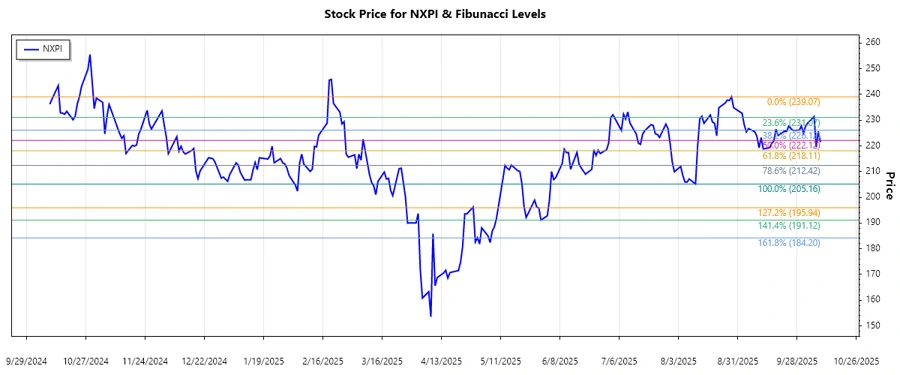
The NXP Semiconductors N.V. (NXPI) stock has recently witnessed fluctuations with pivotal highs and lows. The semiconductor market's inherent volatility combined with NXP's solid positioning in automotive and IoT sectors influences this dynamic. Traders and analysts should keep an eye on these trends and retracement levels as potential indicators of future price movement.
Fibonacci Analysis
| Attribute | Value |
|---|---|
| Start Date | 2025-08-08 |
| End Date | 2025-09-16 |
| High Price | $239.07 (2025-08-28) |
| Low Price | $205.16 (2025-08-11) |
Fibonacci Retracement Levels
| Level | Price |
|---|---|
| 0.236 | $213.45 |
| 0.382 | $217.78 |
| 0.5 | $222.12 |
| 0.618 | $226.47 |
| 0.786 | $232.16 |
The current price sits around $221.42, touching the 0.382 retracement level. This might indicate a minor resistance, signaling potential consolidation before a breakout.
In technical terms, retracement levels, especially around 0.5 and 0.618, often act as significant support or resistance. Given the price vicinity to 0.382, traders should be cautious of volatility.
Conclusion
Overall, NXP Semiconductors N.V. shows a steady presence in the semiconductor industry despite recent stock volatility. As we've seen, certain Fibonacci levels are serving as structural areas for potential trade decision-making. Continuous technological advancement in sectors like IoT and automotive ensures NXP's market presence, but it remains susceptible to broader economic shifts. Analysts should consider macroeconomic factors when anticipating future market behavior for NXPI stocks.
Smart Data Insight
Master the Perfect Entry & Exit for this Stock
Don't leave your profits to chance. Historically, this stock follows specific seasonal patterns that institutional traders use to maximize returns.
- ✅ Identify the "Golden Buying Window"
- ✅ Avoid high-risk correction cycles
- ✅ Backtested data from the last 20+ years