March 18, 2026 a 03:31 am
NXPI: Dividend Analysis - NXP Semiconductors N.V.
NXP Semiconductors N.V. has a robust dividend profile with a stable dividend history and an ample yield. While the sector's cyclical nature might pose challenges, the company's consistent dividend growth points to a well-managed strategy. Investors may find the payout ratio appealing as it suggests a sustainable dividend distribution backed by strong financials.
📊 Overview
Being in the technology sector, NXP Semiconductors offers a dividend yield of approximately 2.09%, which reflects its balanced approach towards rewarding shareholders and reinvesting for growth.
| Factor | Details |
|---|---|
| Sector | Technology |
| Dividend Yield | 2.09% |
| Current Dividend per Share | 4.06 USD |
| Dividend History | 9 years |
| Last Cut or Suspension | None |
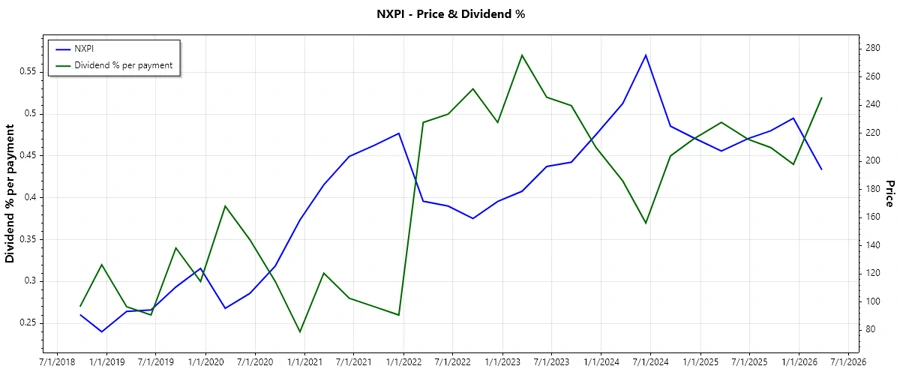
📈 Dividend History
NXP Semiconductors has consistently rewarded its investors with dividends, reflecting both its healthy cash flow and commitment to returning value to shareholders. Understanding the dividend history provides insights into the company’s reliability in cash distributions.
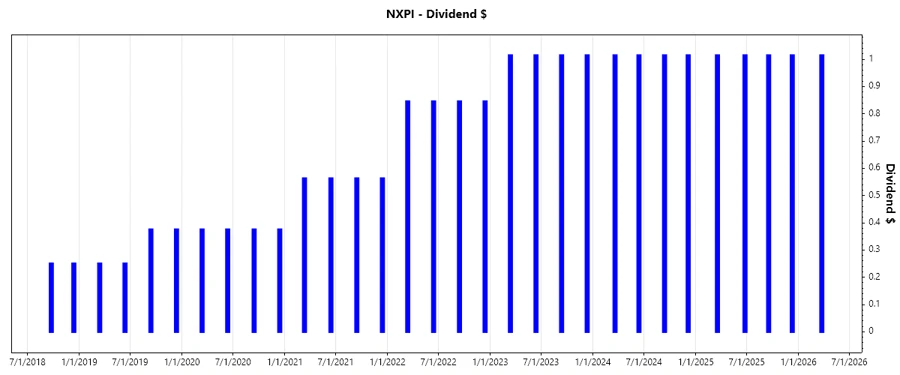
| Year | Dividend per Share (USD) |
|---|---|
| 2026 | 1.01 |
| 2025 | 4.06 |
| 2024 | 4.06 |
| 2023 | 4.06 |
| 2022 | 3.38 |
📉 Dividend Growth
Monitoring dividend growth is vital as it indicates how the company has scaled its dividends over the years. NXP’s growth provides confidence in its financial strategy and operational effectiveness.
| Time | Growth |
|---|---|
| 3 years | 6.27% |
| 5 years | 22.01% |
The average dividend growth is 22.01% over 5 years. This shows moderate but steady dividend growth.
✅ Payout Ratio
The payout ratio is essential for assessing how sustainable the dividend payments are. High ratios could indicate a risk to future payments if earnings falter, while moderate to low ratios suggest sustainability.
| Key Figure | Ratio |
|---|---|
| EPS-based | 50.69% |
| Free Cash Flow-based | 38.75% |
With a payout ratio of 50.69% (EPS) and 38.75% (FCF), NXP shows a balanced strategy, allocating profits to dividends without compromising reinvestment in core operations.
🗣️ Cashflow & Capital Efficiency
Assessing cash flows and capital efficiency provides insight into the company’s ability to generate and use cash creatively.
| Metric | 2023 | 2024 | 2025 |
|---|---|---|---|
| Free Cash Flow Yield | 4.22% | 3.87% | 4.42% |
| Earnings Yield | 4.71% | 4.73% | 3.68% |
| CAPEX to Operating Cash Flow | 28.64% | 26.13% | 14.08% |
| Stock-based Compensation to Revenue | 3.10% | 3.65% | 0% |
| Free Cash Flow / Operating Cash Flow Ratio | 71.36% | 73.87% | 85.92% |
NXP exhibits a healthy free cash flow yield and an efficient use of capital, evidenced by a stable CAPEX to cash flow ratio.
🗣️ Balance Sheet & Leverage Analysis
The balance sheet provides a snapshot of financial health and leverage, showing how debt is balanced with equity to pursue strategic growth without over-leveraging.
| Metric | 2023 | 2024 | 2025 |
|---|---|---|---|
| Debt-to-Equity | 1.29 | 1.18 | 1.21 |
| Debt-to-Assets | 45.89% | 44.51% | 46.02% |
| Debt-to-Capital | 56.39% | 54.17% | 54.86% |
| Net Debt to EBITDA | 1.54 | 1.77 | 2.35 |
| Current Ratio | 1.91 | 2.36 | 2.05 |
| Quick Ratio | 1.39 | 1.60 | 1.38 |
| Financial Leverage | 2.82 | 2.66 | 2.64 |
The company's financial leverage and liquidity ratios suggest a well-managed balance sheet with effective risk management and strategic leveraging.
📊 Fundamental Strength & Profitability
Evaluating profitability metrics is key to understanding the efficiency and effectiveness of a company in generating profits from its revenues.
| Metric | 2023 | 2024 | 2025 |
|---|---|---|---|
| Return on Equity | 32.36% | 27.33% | 20.10% |
| Return on Assets | 11.49% | 10.29% | 7.61% |
| Margins: Net | 21.07% | 19.90% | 16.47% |
| Margins: EBIT | 28.55% | 27.72% | 24.26% |
| Margins: EBITDA | 36.88% | 35.06% | 31.05% |
| Margins: Gross | 56.89% | 56.44% | 54.43% |
| Research & Development to Revenue | 18.21% | 18.61% | 18.31% |
The robust return ratios and healthy margins underscore NXP's strong operational performance and its commitment to R&D, supporting long-term growth and innovation.
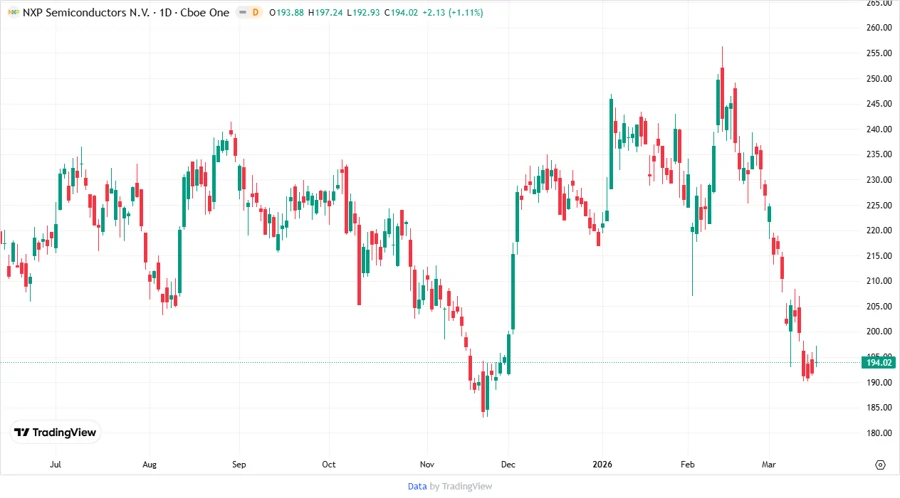
📈 Price Development
🗣️ Dividend Scoring System
| Category | Score | Reliability |
|---|---|---|
| Dividend yield | 3 | |
| Dividend Stability | 4 | |
| Dividend Growth | 4 | |
| Payout Ratio | 4 | |
| Financial Stability | 4 | |
| Dividend Continuity | 5 | |
| Cashflow Coverage | 4 | |
| Balance Sheet Quality | 4 |
Overall: 32 / 40
Rating
Given the thorough assessment of its dividend potential and financial stability, NXP Semiconductors scores well, making it a suitable candidate for investors seeking both growth and stability within the semiconductor sector. Retaining robust fundamentals and a commitment to shareholder returns, NXP remains a strong pick for dividend-focused portfolios.