January 01, 2026 a 07:30 am


NXPI: Dividend Analysis - NXP Semiconductors N.V.
NXP Semiconductors N.V. offers a steady and disciplined dividend policy, complemented by consistent capital efficiency and sound financial fundamentals. The company's growing free cash flow and commitment to R&D underpin its resilient market position.
📊 Overview
NXP Semiconductors operates primarily in the semiconductor industry. This review outlines its dividend performance and financial health.
| Attribute | Value |
|---|---|
| Sector | Semiconductor |
| Dividend Yield | 1.76% |
| Current Dividend per Share | 4.07 USD |
| Dividend History | 8 years |
| Last Cut or Suspension | None |
📈 Dividend History
The company's consistent dividend payments over the years reflect financial stability, contributing to investor confidence.
| Year | Dividend per Share (USD) |
|---|---|
| 2025 | 4.056 |
| 2024 | 4.056 |
| 2023 | 4.056 |
| 2022 | 3.380 |
| 2021 | 2.250 |
📉 Dividend Growth
NXP's future attractiveness is magnified by its reliable dividend growth, showcasing strong long-term outlooks and shareholder value intent.
| Time | Growth |
|---|---|
| 3 years | 6.27% |
| 5 years | 22.01% |
The average dividend growth is 22.01% over 5 years. This shows moderate but steady dividend growth.
✅ Payout Ratio
The payout ratio indicates how much of the company's earnings are returned to shareholders in the form of dividends. A balanced ratio suggests sustainable dividend policies.
| Key figure | Ratio |
|---|---|
| EPS-based | 49.76% |
| Free cash flow-based | 49.55% |
The payout ratios, both EPS-based and cash flow-based, are similar, indicating disciplined financial management and sustainable dividends.
📊 Cashflow & Capital Efficiency
Examining cash flow and capital efficiency reflects how effectively NXP converts its investments into cash, ensuring robust operational performance.
| Year | 2022 | 2023 | 2024 |
|---|---|---|---|
| Free Cash Flow Yield | 6.45% | 4.22% | 3.87% |
| Earnings Yield | 6.73% | 4.71% | 4.73% |
| CAPEX to Operating Cash Flow | 31.50% | 28.64% | 26.13% |
| Stock-based Compensation to Revenue | 2.76% | 3.10% | 3.65% |
| Free Cash Flow / Operating Cash Flow Ratio | 68.50% | 71.36% | 73.87% |
| Return on Invested Capital | 16.03% | 14.54% | 12.91% |
Consistent cash flow yields and capital efficiency metrics underscore NXP's judicious capital allocation, fundamental for long-term growth.
⚠️ Balance Sheet & Leverage Analysis
Analyzing leverage ratios sheds light on NXP's financial stability and risk, crucial for assessing long-term viability and fiscal prudence.
| Year | 2022 | 2023 | 2024 |
|---|---|---|---|
| Debt-to-Equity | 149.89% | 129.28% | 118.20% |
| Debt-to-Assets | 48.05% | 45.89% | 44.51% |
| Debt-to-Capital | 59.98% | 56.39% | 54.17% |
| Net Debt to EBITDA | 1.50 | 1.54 | 1.77 |
| Current Ratio | 2.12 | 1.91 | 2.36 |
| Quick Ratio | 1.58 | 1.39 | 1.60 |
| Financial Leverage | 3.12 | 2.82 | 2.66 |
NXP illustrates prudent balance sheet management and sufficiently low leverage, indicating strong fiscal health and potential for adaptive financial strategy.
🔍 Fundamental Strength & Profitability
In-depth profitability analysis reflects NXP's global competitiveness and ability to generate wealth efficiently.
| Year | 2022 | 2023 | 2024 |
|---|---|---|---|
| Return on Equity | 37.41% | 32.36% | 27.33% |
| Return on Assets | 11.99% | 11.49% | 10.29% |
| Net Margin | 21.11% | 21.07% | 19.90% |
| EBIT Margin | 28.70% | 28.55% | 27.72% |
| EBITDA Margin | 38.17% | 36.88% | 35.06% |
| Gross Margin | 56.93% | 56.89% | 56.44% |
| R&D to Revenue | 16.27% | 18.21% | 18.61% |
With robust profitability metrics and high ROE, NXP stands out in capital efficiency, vital for competitiveness and innovative leadership.
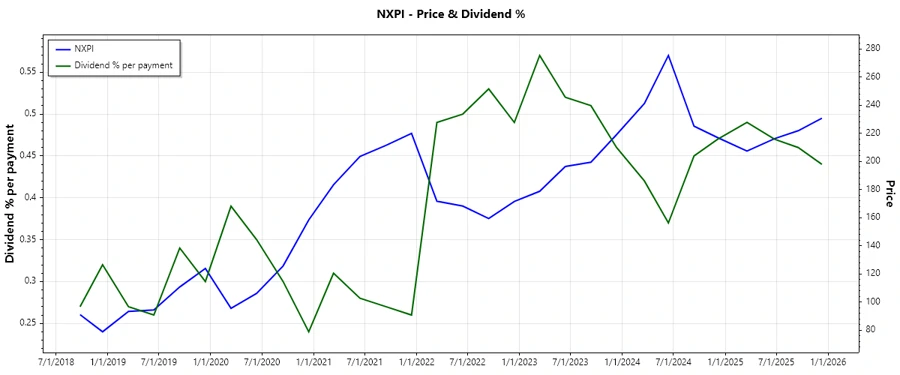
💰 Price Development
✨ Dividend Scoring System
| Category | Score | Visual |
|---|---|---|
| Dividend Yield | 3 | |
| Dividend Stability | 4 | |
| Dividend Growth | 4 | |
| Payout Ratio | 4 | |
| Financial Stability | 5 | |
| Dividend Continuity | 4 | |
| Cashflow Coverage | 4 | |
| Balance Sheet Quality | 5 |
Total Score: 33/40
🗣️ Rating
NXP Semiconductors N.V. demonstrates a robust dividend profile with substantial growth potential, driven by consistent financial performance and strategic investments. The company's commitment to sustainable shareholder returns and its strength in capital management provide a favorable outlook for long-term investors. It is suitable for investors seeking stable growth and income.