November 23, 2025 a 02:46 am

NXPI: Dividend Analysis - NXP Semiconductors N.V.
NXP Semiconductors offers a competitive dividend profile with consistent payouts and growth potential. With a stable dividend yield and a growing history, the firm presents a reliable option for dividend-seeking investors. As we dive deeper into the company's financial metrics, we'll evaluate the sustainability and growth prospects of its dividends alongside other crucial financial indicators.
📊 Overview
The company operates in the technology sector, maintaining a respectable dividend yield of 2.12%. With a current dividend per share of USD 4.07 and a consistent dividend history over 8 years, NXP Semiconductors has demonstrated reliability. Notably, there have been no recent cuts or suspensions, underlining its commitment to shareholders.
| Attribute | Value |
|---|---|
| Sector | Technology |
| Dividend yield | 2.12% |
| Current dividend per share | 4.07 USD |
| Dividend history | 8 years |
| Last cut or suspension | None |
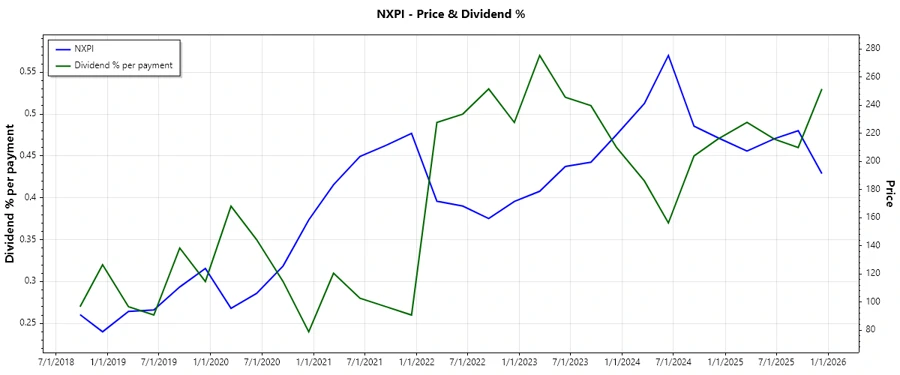
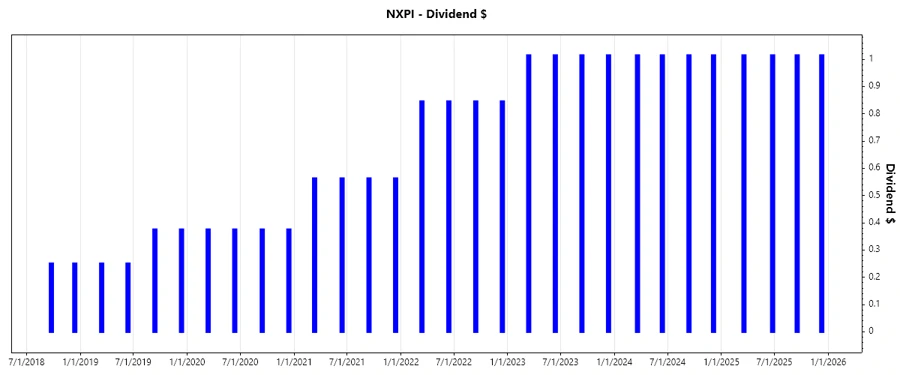
📈 Dividend History
A consistent dividend history is crucial as it reflects a company's ability to return capital to its investors regularly. NXP Semiconductors has maintained a stable payout over recent years, showcasing financial health and corporate commitment to dividends.
| Year | Dividend per Share (USD) |
|---|---|
| 2025 | 4.056 |
| 2024 | 4.056 |
| 2023 | 4.056 |
| 2022 | 3.380 |
| 2021 | 2.250 |
📈 Dividend Growth
Dividend growth over the years highlights potential future returns and indicates the company’s financial robustness. NXP Semiconductors displays strong commitment to increasing shareholder value through its growing dividends.
| Time | Growth |
|---|---|
| 3 years | 21.70% |
| 5 years | 26.54% |
The average dividend growth is 26.54% over 5 years. This shows moderate but steady dividend growth, illustrating effective management and financial sustainability.
✅ Payout Ratio
Payout ratios are vital in assessing how much profit a company returns as dividends, indicating sustainability. NXP's payout ratios suggest a balanced approach between rewarding shareholders and retaining earnings for growth.
| Key figure | Ratio |
|---|---|
| EPS-based | 49.76% |
| Free cash flow-based | 49.55% |
With an EPS payout ratio of 49.76% and a free cash flow payout ratio of 49.55%, NXP Semiconductors maintains ample room for further dividend enhancements or business reinvestment.
📊 Cashflow & Capital Efficiency
The analysis of cash flows and capital efficiency offers insights into the company's fiscal health and resource management. It plays a critical role in determining a company's ability to sustain dividends.
| Year | 2024 | 2023 | 2022 |
|---|---|---|---|
| Free Cash Flow Yield | 3.87% | 4.22% | 6.45% |
| Earnings Yield | 4.73% | 4.71% | 6.73% |
| CAPEX to Operating Cash Flow | 26.13% | 28.64% | 31.50% |
| Stock-based Compensation to Revenue | 3.65% | 3.10% | 2.76% |
| Free Cash Flow / Operating Cash Flow Ratio | 73.87% | 71.36% | 68.50% |
| Return on Invested Capital | 12.91% | 14.54% | 16.02% |
NXP's fiscal records indicate robust cashflow stability and efficient capital utilization, fortifying its dividend policy and financial foundations.
⚖️ Balance Sheet & Leverage Analysis
A thorough analysis of balance sheets and leverage ratios sheds light on the company's risk profile and its ability to meet obligations while pursuing growth opportunities.
| Year | 2024 | 2023 | 2022 |
|---|---|---|---|
| Debt-to-Equity | 118.20% | 129.28% | 149.89% |
| Debt-to-Assets | 44.51% | 45.89% | 48.05% |
| Debt-to-Capital | 54.17% | 56.39% | 59.98% |
| Net Debt to EBITDA | 1.77 | 1.54 | 1.50 |
| Current Ratio | 2.35 | 1.91 | 2.12 |
| Quick Ratio | 1.60 | 1.39 | 1.58 |
| Financial Leverage | 2.66 | 2.82 | 3.12 |
The analysis shows NXP's capability to manage leverage effectively, maintaining adequate liquidity and financial flexibility to support its ongoing operations and expansion endeavors.
💼 Fundamental Strength & Profitability
Evaluating fundamental strength and profitability metrics offers comprehensive insights into NXP's operational efficiency and growth potential, reflecting its economic moat and competitive positioning.
| Year | 2024 | 2023 | 2022 |
|---|---|---|---|
| Return on Equity | 27.33% | 32.36% | 37.41% |
| Return on Assets | 10.29% | 11.49% | 11.99% |
| Net Margin | 19.90% | 21.07% | 21.11% |
| EBIT Margin | 27.72% | 28.55% | 28.70% |
| EBITDA Margin | 35.06% | 36.88% | 38.17% |
| Gross Margin | 56.44% | 56.89% | 56.93% |
| Research & Development to Revenue | 19.15% | 18.21% | 16.27% |
NXP’s profitability metrics are solid, indicating efficient use of assets and equity, which underpin its capacity to generate returns while investing in research and development for sustained growth.
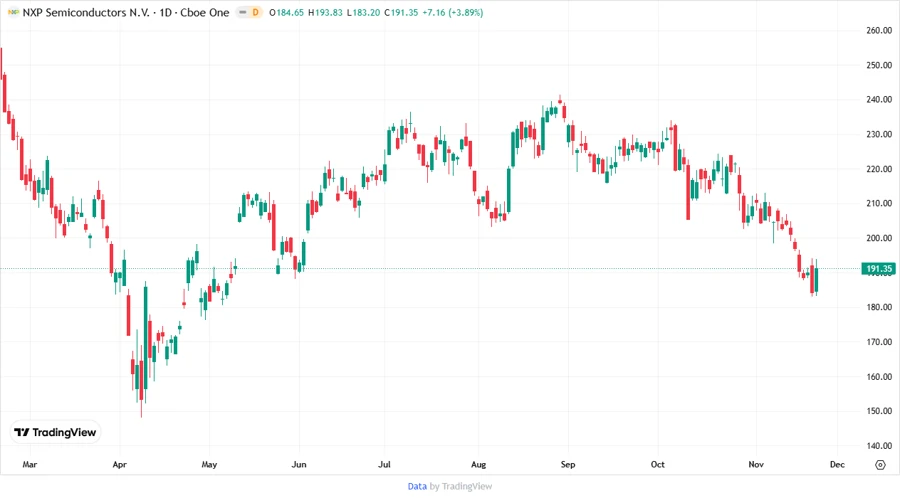
🔍 Price Development
✅ Dividend Scoring System
| Criteria | Score | Bar |
|---|---|---|
| Dividend Yield | 4 | |
| Dividend Stability | 4 | |
| Dividend Growth | 4 | |
| Payout Ratio | 4 | |
| Financial Stability | 4 | |
| Dividend Continuity | 5 | |
| Cashflow Coverage | 4 | |
| Balance Sheet Quality | 4 |
Total Score: 33/40
🗣️ Rating
NXP Semiconductors exemplifies solid dividend characteristics with a focus on consistent growth and stable payouts. Its sound financial metrics further support its ability to sustain and potentially enhance dividends. Given these factors, NXP Semiconductors is a strong candidate for dividend investors seeking stability and moderate growth potential in the technology sector.
Smart Data Insight
Master the Perfect Entry & Exit for this Stock
Don't leave your profits to chance. Historically, this stock follows specific seasonal patterns that institutional traders use to maximize returns.
- ✅ Identify the "Golden Buying Window"
- ✅ Avoid high-risk correction cycles
- ✅ Backtested data from the last 20+ years