August 31, 2025 a 02:47 am

NXPI: Dividend Analysis - NXP Semiconductors N.V.
NXP Semiconductors N.V. demonstrates a promising dividend profile with a stable growth track over the past years. The company's consistent payout with no recent cuts or suspensions reflects confidence in its cash flow management and financial strategy. Investors may find this stock appealing due to its sound dividend yield and potential for further growth.
Overview 📊
NXP Semiconductors operates in a competitive sector, providing technology solutions across multiple industries. The company's dividend yield stands at 1.73%, with a current dividend per share of 4.07 USD. Its dividend history spans over 8 years without any cuts or suspensions.
| Metric | Details |
|---|---|
| Sector | Semiconductors |
| Dividend Yield | 1.73% |
| Current Dividend per Share | 4.07 USD |
| Dividend History | 8 years |
| Last Cut or Suspension | None |
Dividend History 📈
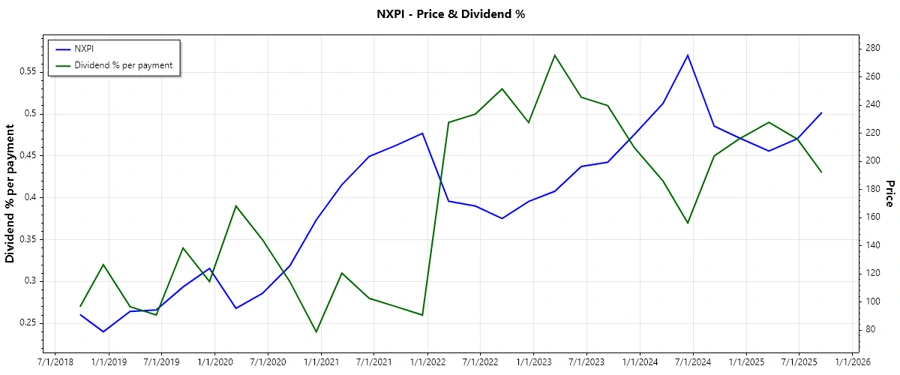
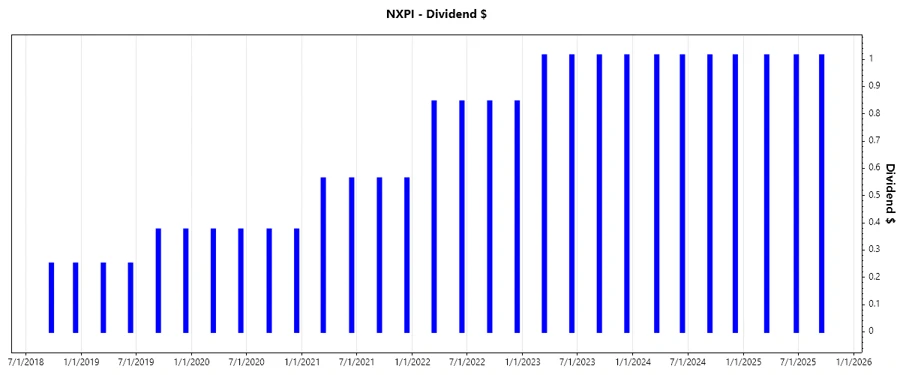
The historical dividend payouts reflect NXP’s commitment to delivering stable returns to shareholders. This history is crucial for evaluating dividend reliability and company performance during market fluctuations.
| Year | Dividend per Share (USD) |
|---|---|
| 2025 | 3.042 |
| 2024 | 4.056 |
| 2023 | 4.056 |
| 2022 | 3.380 |
| 2021 | 2.250 |
Dividend Growth 🏦
Examining the growth of dividends is essential for understanding the potential for future earnings. NXP exhibits moderate but steady dividend growth, indicating resilience and potential long-term benefits for investors.
| Time | Growth |
|---|---|
| 3 years | 21.70% |
| 5 years | 26.54% |
The average dividend growth is 26.54% over 5 years. This shows moderate but steady dividend growth, enhancing investor confidence in the company’s financial health.
Payout Ratio 💼
Payout ratios offer insights into the sustainability of dividend payments. Evaluation using EPS and Free Cash Flow reflect on the company's commitment to maintaining dividends without compromising financial health.
| Key figure | Ratio |
|---|---|
| EPS-based | 47.80% |
| Free cash flow-based | 48.26% |
The EPS-based payout ratio of 47.80% and Free Cash Flow-based payout ratio of 48.26% indicate a balanced approach between reinvesting earnings for growth and rewarding shareholders.
Cashflow & Capital Efficiency 💰
Examining the cash flow and capital efficiency metrics is vital for assessing the company's ability to generate sufficient cash to cover its dividends and support future growth.
| Year | 2024 | 2023 | 2022 |
|---|---|---|---|
| Free Cash Flow Yield | 3.87% | 4.22% | 6.45% |
| Earnings Yield | 4.73% | 4.71% | 6.73% |
| CAPEX to Operating Cash Flow | 26.13% | 28.64% | 31.50% |
| Stock-based Compensation to Revenue | 3.65% | 3.10% | 2.76% |
| Free Cash Flow / Operating Cash Flow Ratio | 73.87% | 71.36% | 68.50% |
The analysis indicates that NXP Semiconductors effectively manages capital and cash flows, supporting its dividend distribution and indicating robust capital efficiency.
Balance Sheet & Leverage Analysis 📊
The balance sheet and leverage ratios provide insights into the company's financial health, especially its ability to cover liabilities and manage debt.
| Year | 2024 | 2023 | 2022 |
|---|---|---|---|
| Debt-to-Equity | 1.18 | 1.29 | 1.50 |
| Debt-to-Assets | 0.45 | 0.46 | 0.48 |
| Debt-to-Capital | 0.54 | 0.56 | 0.60 |
| Net Debt to EBITDA | 1.77 | 1.54 | 1.50 |
| Current Ratio | 2.36 | 1.91 | 2.12 |
| Quick Ratio | 1.60 | 1.39 | 1.58 |
| Financial Leverage | 2.65 | 2.82 | 3.12 |
NXP showcases decent financial leverage and liquidity, with current and quick ratios suggesting adequate coverage for short-term liabilities and prudent debt management.
Fundamental Strength & Profitability 🏆
Profitability ratios evaluate the operational efficiency and earning potential of NXP, reflecting its overall financial strength.
| Year | 2024 | 2023 | 2022 |
|---|---|---|---|
| Return on Equity | 27.33% | 32.36% | 37.41% |
| Return on Assets | 10.29% | 11.49% | 11.99% |
| Margins (Net) | 19.90% | 21.07% | 21.11% |
| Margins (EBIT) | 27.72% | 28.55% | 28.70% |
| Margins (EBITDA) | 35.06% | 36.88% | 38.17% |
| Margins (Gross) | 56.44% | 56.89% | 56.93% |
| R&D to Revenue | 19.05% | 18.21% | 16.27% |
NXP's consistent profitability and high return on equity underpin its competitive advantage and capacity to maintain growth and shareholder value.
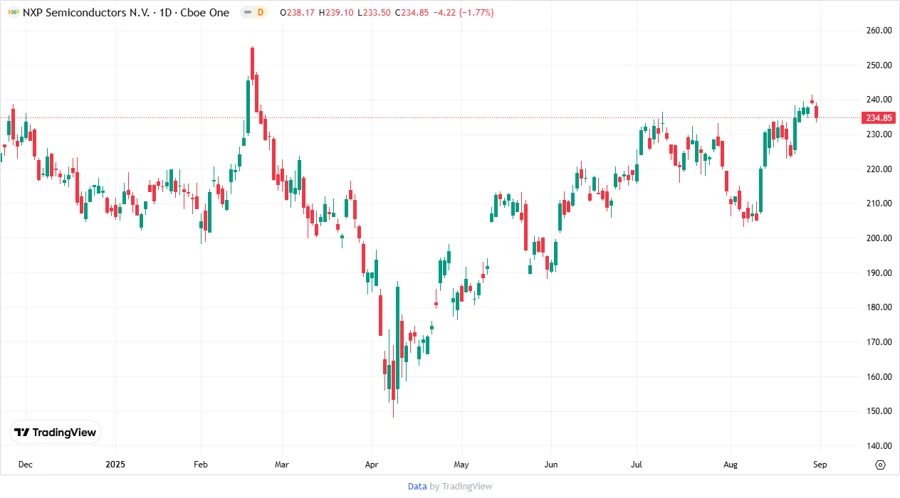
Price Development 📉
Dividend Scoring System 📊
| Criteria | Score | Bar |
|---|---|---|
| Dividend Yield | 3 | |
| Dividend Stability | 4 | |
| Dividend Growth | 4 | |
| Payout Ratio | 4 | |
| Financial Stability | 4 | |
| Dividend Continuity | 5 | |
| Cashflow Coverage | 4 | |
| Balance Sheet Quality | 4 |
Total Score: 32/40
Rating ✅
Overall, NXP Semiconductors N.V. presents a robust dividend profile suited for long-term investors seeking moderate yield with prospects of stable growth. Its solid financial metrics and stable payout strategy mark it as a reliable choice amidst semiconductor industry stocks.