FTNT: Fundamental Ratio Analysis - Fortinet Inc
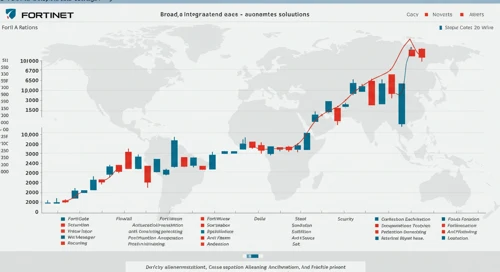
FTNT: Evaluation of key financial ratios, analyst ratings, and price targets. A data-driven perspective on the valuation and market expectations.
April 13, 2026 a 03:43 pm
PANW: Fibunacci Level Technical Analysis - Palo Alto Networks Inc
PANW: Fibonacci retracement levels to identify key potential support and resistance zones, based on recent price trends.
April 13, 2026 a 03:15 pm
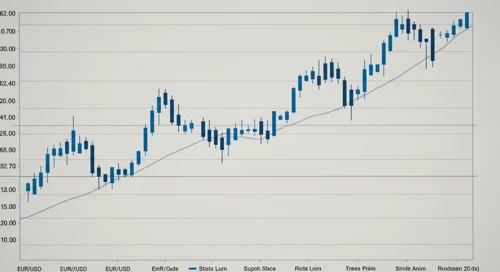
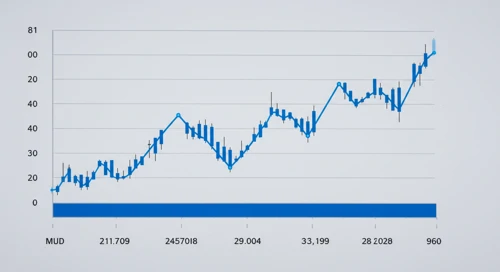
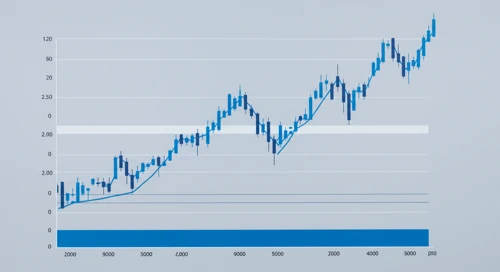
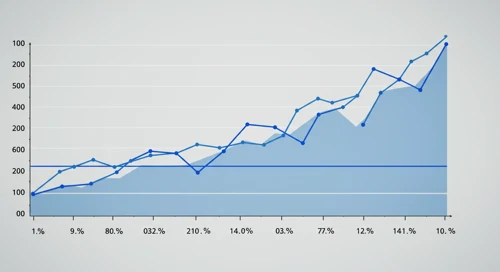
Currencies Comparison. 13 Apr

Comparison of Currencies. Where is strength and weakness? What has developed well and badly?
April 13, 2026 a 03:07 pm
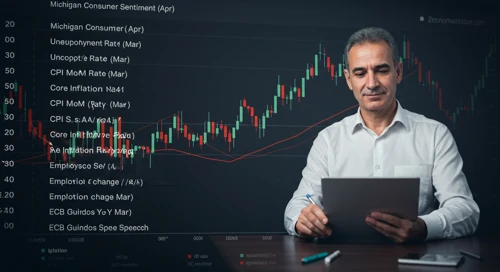
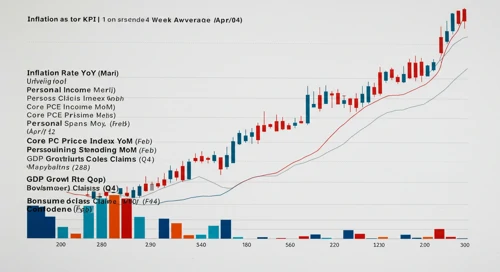
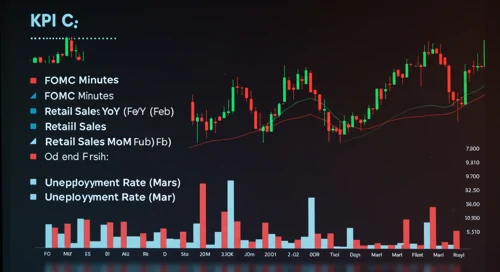
Todays Important Key Figures 13 Apr

Today’s important economic data releases – a snapshot of key indicators influencing markets and shaping financial expectations.
April 13, 2026 a 03:00 pm
META: Trend with Support and Resistance Levels - Meta Platforms Inc
META: Current price trend is evaluated alongside key support and resistance level. View of potential turning points and price momentum.
April 13, 2026 a 02:03 pm
MU: Trend with Support and Resistance Levels - Micron Technology Inc
MU: Current price trend is evaluated alongside key support and resistance level. View of potential turning points and price momentum.
April 13, 2026 a 01:15 pm
UNP: Analysts Ratings - Union Pacific Corporation
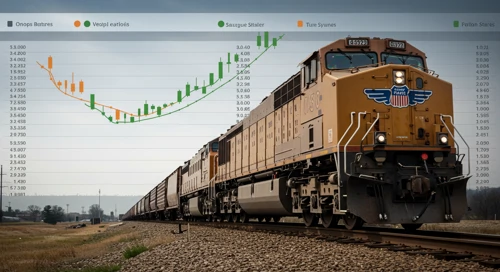
UNP: Comprehensive breakdown of current and historical analyst ratings, offering insights into how expert sentiment has evolved over time.
April 13, 2026 a 01:00 pm

FICO: Fundamental Ratio Analysis - Fair Isaac Corporation
April 13, 2026 a 06:00 pm
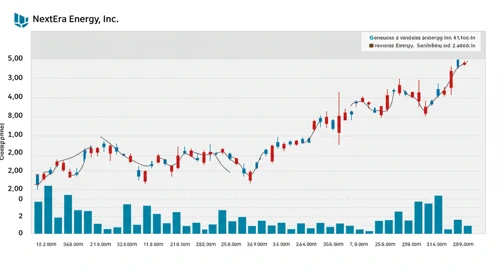
NEE: Analysts Ratings - NextEra Energy Inc
April 13, 2026 a 05:00 pm
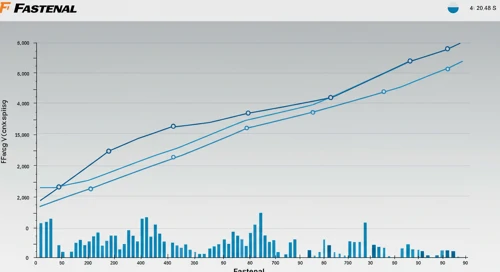
FAST: Fibunacci Level Technical Analysis - Fastenal Company
April 13, 2026 a 04:44 pm

DE: Analysts Ratings - Deere and Company
April 13, 2026 a 04:38 pm
EQIX: Fundamental Ratio Analysis - Equinix Inc
EQIX: Evaluation of key financial ratios, analyst ratings, and price targets. A data-driven perspective on the valuation and market expectations.
April 13, 2026 a 01:00 pm
JKHY: Dividend Analysis - Jack Henry and Associates Inc

JKHY: In-depth analysis of a company's dividend stability and key fundamental ratios to assess its financial strength and long-term investment potential.
April 13, 2026 a 12:46 pm
ABNB: Analysts Ratings - Airbnb Inc

ABNB: Comprehensive breakdown of current and historical analyst ratings, offering insights into how expert sentiment has evolved over time.
April 13, 2026 a 12:38 pm
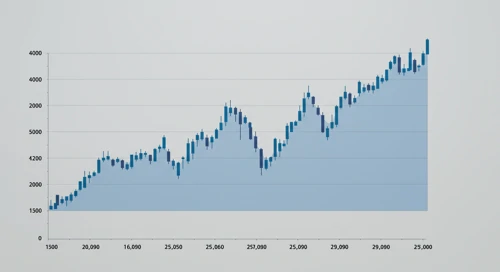
America Comparison. 13 Apr
Comparison of America. Where is strength and weakness? What has developed well and badly?
April 13, 2026 a 12:31 pm
DGX: Fibunacci Level Technical Analysis - Quest Diagnostics Incorporated
DGX: Fibonacci retracement levels to identify key potential support and resistance zones, based on recent price trends.
April 13, 2026 a 11:44 am
MSCI: Fundamental Ratio Analysis - MSCI Inc

MSCI: Evaluation of key financial ratios, analyst ratings, and price targets. A data-driven perspective on the valuation and market expectations.
April 13, 2026 a 11:43 am
BK: Dividend Analysis - The Bank of New York Mellon Corporation

BK: In-depth analysis of a company's dividend stability and key fundamental ratios to assess its financial strength and long-term investment potential.
April 13, 2026 a 11:31 am
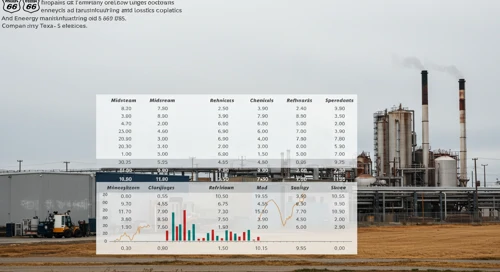
Stock Market - Heatmap
Use mouse wheel to zoom in and out. Click a ticker to display detailed information in a new window. Hover mouse cursor over a ticker to see more data.
Stock's
EG: Fundamental Ratio Analysis - Everest Re Group Ltd

EG: Evaluation of key financial ratios, analyst ratings, and price targets. A data-driven perspective on the valuation and market expectations.
April 13, 2026 a 08:00 am
PPL: Dividend Analysis - PPL Corporation

PPL: In-depth analysis of a company's dividend stability and key fundamental ratios to assess its financial strength and long-term investment potential.
April 13, 2026 a 07:46 am
PARA: Fundamental Ratio Analysis - Paramount Global
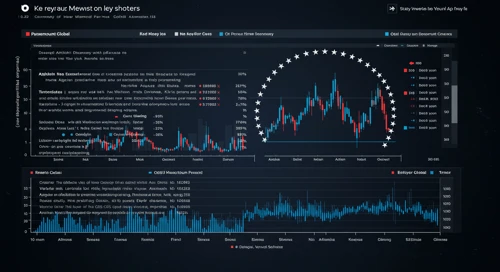
PARA: Evaluation of key financial ratios, analyst ratings, and price targets. A data-driven perspective on the valuation and market expectations.
April 13, 2026 a 07:43 am
WDAY: Fibunacci Level Technical Analysis - Workday Inc
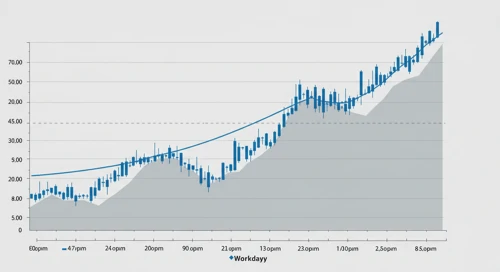
WDAY: Fibonacci retracement levels to identify key potential support and resistance zones, based on recent price trends.
April 13, 2026 a 06:44 am
BAC: Fibunacci Level Technical Analysis - Bank of America Corporation
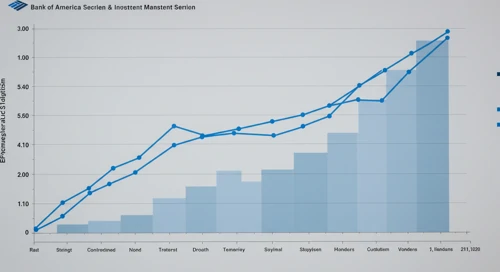
BAC: Fibonacci retracement levels to identify key potential support and resistance zones, based on recent price trends.
April 13, 2026 a 05:15 am
ADSK: Trend with Support and Resistance Levels - Autodesk Inc
ADSK: Current price trend is evaluated alongside key support and resistance level. View of potential turning points and price momentum.
April 13, 2026 a 04:03 am
FDX: Dividend Analysis - FedEx Corporation

FDX: In-depth analysis of a company's dividend stability and key fundamental ratios to assess its financial strength and long-term investment potential.
April 13, 2026 a 03:31 am
CSGP: Fibunacci Level Technical Analysis - CoStar Group Inc
April 13, 2026 a 10:15 am
MSCI: Trend with Support and Resistance Levels - MSCI Inc
April 13, 2026 a 09:03 am
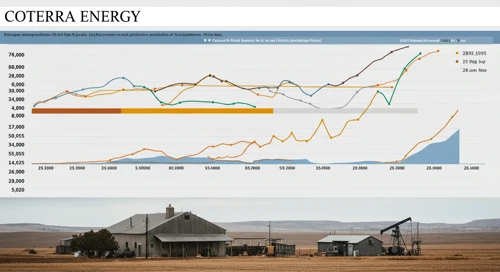
CTRA: Analysts Ratings - Coterra Energy Inc
April 13, 2026 a 09:00 am
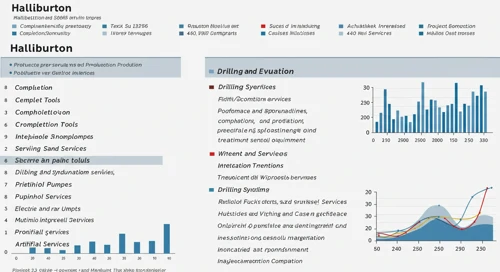
HAL: Analysts Ratings - Halliburton Company
April 13, 2026 a 08:38 am
AES: Trend with Support and Resistance Levels - The AES Corporation
AES: Current price trend is evaluated alongside key support and resistance level. View of potential turning points and price momentum.
April 13, 2026 a 03:15 am
SHW: Dividend Analysis - The Sherwin Williams Company

SHW: In-depth analysis of a company's dividend stability and key fundamental ratios to assess its financial strength and long-term investment potential.
April 13, 2026 a 02:46 am
SYK: Analysts Ratings - Stryker Corporation
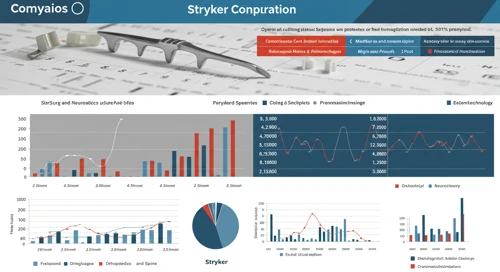
SYK: Comprehensive breakdown of current and historical analyst ratings, offering insights into how expert sentiment has evolved over time.
April 12, 2026 a 09:00 pm
PSX: Analysts Ratings - Phillips 66
PSX: Comprehensive breakdown of current and historical analyst ratings, offering insights into how expert sentiment has evolved over time.
April 12, 2026 a 08:38 pm
FITB: Fundamental Ratio Analysis - Fifth Third Bancorp

FITB: Evaluation of key financial ratios, analyst ratings, and price targets. A data-driven perspective on the valuation and market expectations.
April 12, 2026 a 07:43 pm
UNH: Fundamental Ratio Analysis - UnitedHealth Group Incorporated
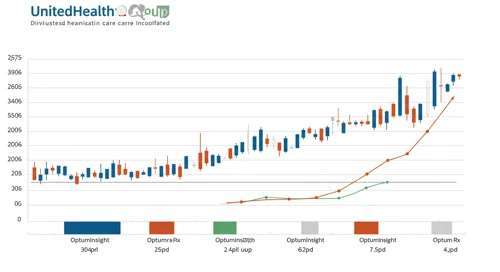
UNH: Evaluation of key financial ratios, analyst ratings, and price targets. A data-driven perspective on the valuation and market expectations.
April 12, 2026 a 06:00 pm
DHI: Analysts Ratings - DR Horton Inc
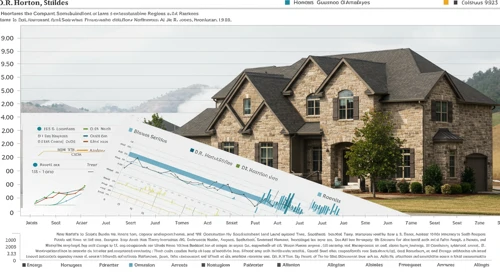
DHI: Comprehensive breakdown of current and historical analyst ratings, offering insights into how expert sentiment has evolved over time.
April 12, 2026 a 05:00 pm
Economic Calendar
Currencies
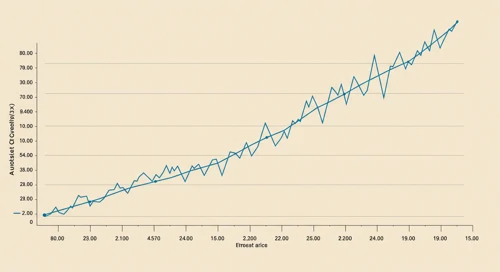
AUDUSD: Fibunacci Level Technical Analysis
AUDUSD: Fibonacci retracement levels to identify key potential support and resistance zones, based on recent price trends.
April 11, 2026 a 05:08 am
EURUSD: Trend with Support and Resistance Levels
EURUSD: Current price trend is evaluated alongside key support and resistance level. View of potential turning points and price momentum.
April 11, 2026 a 04:28 am
Todays Important Key Figures 11 Apr
Today’s important economic data releases – a snapshot of key indicators influencing markets and shaping financial expectations.
April 10, 2026 a 11:00 pm
Todays Important Key Figures 10 Apr
Today’s important economic data releases – a snapshot of key indicators influencing markets and shaping financial expectations.
April 10, 2026 a 07:00 pm
GBPCHF: Fibunacci Level Technical Analysis

GBPCHF: Fibonacci retracement levels to identify key potential support and resistance zones, based on recent price trends.
April 10, 2026 a 05:08 am
CADCHF: Trend with Support and Resistance Levels

CADCHF: Current price trend is evaluated alongside key support and resistance level. View of potential turning points and price momentum.
April 10, 2026 a 04:28 am
Todays Important Key Figures 09 Apr
Today’s important economic data releases – a snapshot of key indicators influencing markets and shaping financial expectations.
April 09, 2026 a 07:00 pm
AUDCAD: Fibunacci Level Technical Analysis
April 13, 2026 a 05:08 am
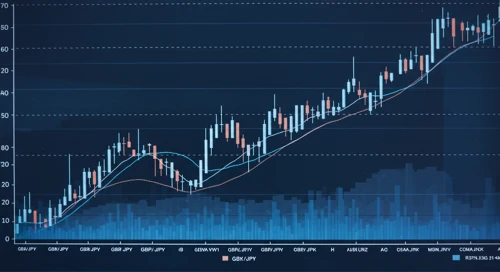
GBPJPY: Trend with Support and Resistance Levels
April 13, 2026 a 04:28 am
GBPAUD: Fibunacci Level Technical Analysis
April 12, 2026 a 05:08 am
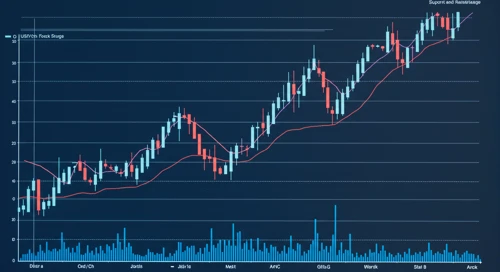
USDCHF: Trend with Support and Resistance Levels
April 12, 2026 a 04:28 am
EURAUD: Fibunacci Level Technical Analysis
EURAUD: Fibonacci retracement levels to identify key potential support and resistance zones, based on recent price trends.
April 09, 2026 a 05:08 am
CADJPY: Trend with Support and Resistance Levels
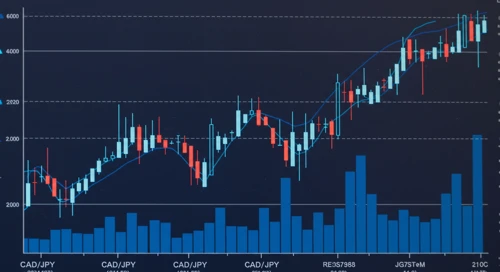
CADJPY: Current price trend is evaluated alongside key support and resistance level. View of potential turning points and price momentum.
April 09, 2026 a 04:28 am
Important Key Figures of the last Days
Overview of key economic indicators released over the past days, highlighting their potential impact on markets and investor sentiment.
April 09, 2026 a 02:31 am
Todays Important Key Figures 08 Apr
Today’s important economic data releases – a snapshot of key indicators influencing markets and shaping financial expectations.
April 08, 2026 a 07:00 pm
EURGBP: Fibunacci Level Technical Analysis
EURGBP: Fibonacci retracement levels to identify key potential support and resistance zones, based on recent price trends.
April 08, 2026 a 05:08 am
EURJPY: Trend with Support and Resistance Levels
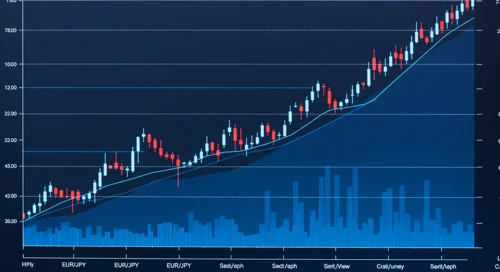
EURJPY: Current price trend is evaluated alongside key support and resistance level. View of potential turning points and price momentum.
April 08, 2026 a 04:28 am
Todays Important Key Figures 07 Apr

Today’s important economic data releases – a snapshot of key indicators influencing markets and shaping financial expectations.
April 07, 2026 a 07:00 pm
Currencies