August 13, 2025 a 12:46 pm


NWS: Dividend Analysis - News Corporation
News Corporation, recognized for its significant role in the media industry, maintains a modest dividend profile. With a focus on steady cash flows, the company manages to pay consistent dividends, albeit with a cautious yield. Its recent dividend history highlights a period of continuity post an adjustment in 2021, marking its strategy to balance shareholder returns with capital allocation priorities.
📊 Overview
News Corporation operates within the media sector, where maintaining a balance between innovation and stable returns is crucial. The company's current dividend yield is at a modest 0.601%, with a sustained dividend payment history of 11 years. The last notable adjustment was in 2021, suggesting careful consideration of market conditions and internal financial health. Overall, News Corp's dividend strategy reflects its sector's challenges and opportunities.
| Detail | Value |
|---|---|
| Sector | Media |
| Dividend Yield | 0.601% |
| Current Dividend per Share | 0.33 USD |
| Dividend History | 11 years |
| Last Cut or Suspension | 2021 |
📈 Dividend History
The dividend history of News Corporation indicates its ability to provide shareholder returns over time. Key to this is the firm's ability to navigate market changes without compromising payout reliability. This historical insight is crucial for projecting future dividend sustainability and growth.
| Year | Dividend per Share (USD) |
|---|---|
| 2025 | 0.20 |
| 2024 | 0.20 |
| 2023 | 0.20 |
| 2022 | 0.20 |
| 2021 | 0.15 |
📉 Dividend Growth
Dividend growth serves as a critical measure of a company's increasing profitability and confidence. Over the last 3 years, News Corporation has seen a slight growth rate of 0.10%, with no significant growth noted over 5 years. These metrics suggest a stable, yet cautious approach to scaling dividend payments.
| Time | Growth |
|---|---|
| 3 years | 0.10% |
| 5 years | 0% |
The average dividend growth is 0% over 5 years. This shows moderate but steady dividend growth.
✅ Payout Ratio
The payout ratio reflects the proportion of earnings paid to shareholders in dividends. For News Corp, the payout ratio based on EPS is 13.53%, and based on FCF, it is 29.31%. This indicates a conservative dividend strategy, with ample room for adjustments based on profitability swings.
| Key figure | Ratio |
|---|---|
| EPS-based | 13.53% |
| Free cash flow-based | 29.31% |
The current EPS payout ratio of 13.53% is sustainable, allowing for dividend growth and financial flexibility. The FCF payout ratio of 29.31% is aligned with a healthy cash flow management.
🗣️ Cashflow & Capital Efficiency
Cashflow and capital efficiency measures are integral to assessing the financial health and operational efficacy. Key metrics such as free cash flow yield and the ratio of CAPEX to operating cash flow provide insights into capital allocation and liquidity management.
| Metric | 2025 | 2024 | 2023 |
|---|---|---|---|
| Free Cash Flow Yield | 3.38% | 3.86% | 5.28% |
| Earnings Yield | 2.75% | 1.71% | 1.33% |
| CAPEX to Operating Cash Flow | 41.62% | 45.17% | 45.70% |
| Stock-based Compensation to Revenue | 0% | 0% | 0% |
| Free Cash Flow / Operating Cash Flow Ratio | 58.38% | 54.83% | 54.30% |
The ratios reflect effective capital utilization and ensure that cash flow is adequately managed to support both operational expenditures and shareholder returns.
📈 Balance Sheet & Leverage Analysis
Assessing leverage and liquidity metrics provides a clear view of financial stability and risk management policies. News Corporation exhibits a structurally sound balance sheet with notable leverage ratios conducive to sustained operations.
| Metric | 2025 | 2024 | 2023 |
|---|---|---|---|
| Debt-to-Equity | 0.34 | 0.50 | 0.52 |
| Debt-to-Assets | 0.19 | 0.24 | 0.25 |
| Debt-to-Capital | 0.25 | 0.33 | 0.34 |
| Net Debt to EBITDA | 0.90 | 1.53 | 2.08 |
| Current Ratio | 1.84 | 1.43 | 1.28 |
| Quick Ratio | 1.72 | 1.33 | 1.18 |
| Financial Leverage | 1.77 | 2.05 | 2.10 |
The balance sheet metrics highlight a controlled leverage strategy, with sufficient liquidity to manage obligations and respond to dynamic market conditions.
✅ Fundamental Strength & Profitability
Fundamental and profitability metrics are pivotal for evaluating operational effectiveness and strategic success. Metrics such as ROE, ROA, and profit margins convey the efficiency in resource utilization and market competitiveness.
| Metric | 2025 | 2024 | 2023 |
|---|---|---|---|
| Return on Equity | 5.29% | 3.28% | 1.85% |
| Return on Assets | 2.99% | 1.59% | 0.88% |
| Margins: Net | 5.49% | 2.64% | 1.51% |
| EBIT Margin | 11.04% | 6.26% | 4.19% |
| EBITDA Margin | 16.47% | 13.53% | 11.58% |
| Gross Margin | 50.37% | 100% | 100% |
| Research & Development to Revenue | 0% | 0% | 0% |
The figures reflect a balanced approach to maintaining profitability while reinvesting in operational capabilities. Sustainable profitability margins, aligned with an adequate ROE, fuel ongoing growth and competitive positioning.
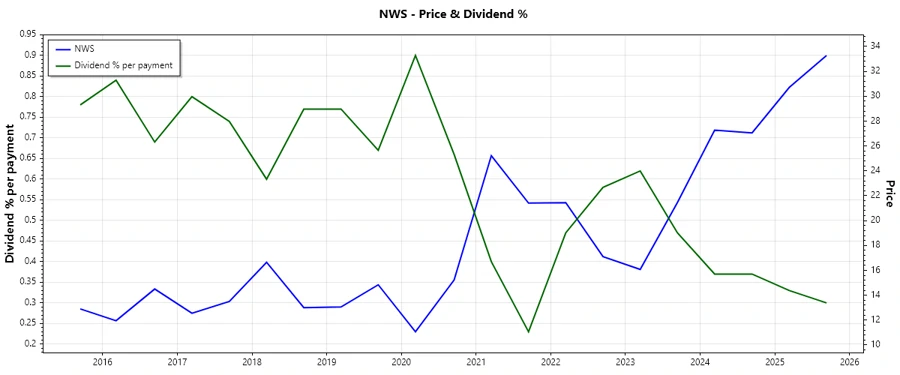
📉 Price Development
✅ Dividend Scoring System
| Criteria | Score | Visualization |
|---|---|---|
| Dividend Yield | 2 | |
| Dividend Stability | 4 | |
| Dividend Growth | 2 | |
| Payout Ratio | 4 | |
| Financial Stability | 3 | |
| Dividend Continuity | 4 | |
| Cashflow Coverage | 3 | |
| Balance Sheet Quality | 3 |
Overall Score: 25/40
Rating
News Corporation provides a strategic approach to dividend payouts, balancing fiscal responsibility with shareholder expectations. The score reflects a stable core with room for growth in yield and financial robustness. The recommendation for current stakeholders is to maintain positions, while potential investors should consider entries at advantageous valuations to benefit from potential growth and income stability.
Smart Data Insight
Master the Perfect Entry & Exit for this Stock
Don't leave your profits to chance. Historically, this stock follows specific seasonal patterns that institutional traders use to maximize returns.
- ✅ Identify the "Golden Buying Window"
- ✅ Avoid high-risk correction cycles
- ✅ Backtested data from the last 20+ years