August 03, 2025 a 09:03 am

NWSA: Trend and Support & Resistance Analysis - News Corporation
News Corporation, a major player in the media and information services sector, has shown varied price movements over the recent months. The trend analysis indicates a possible stabilization with the stock prices as they have approached critical levels. Investors should focus on key technical indicators as they weigh buying or selling decisions for NWSA.
Trend Analysis
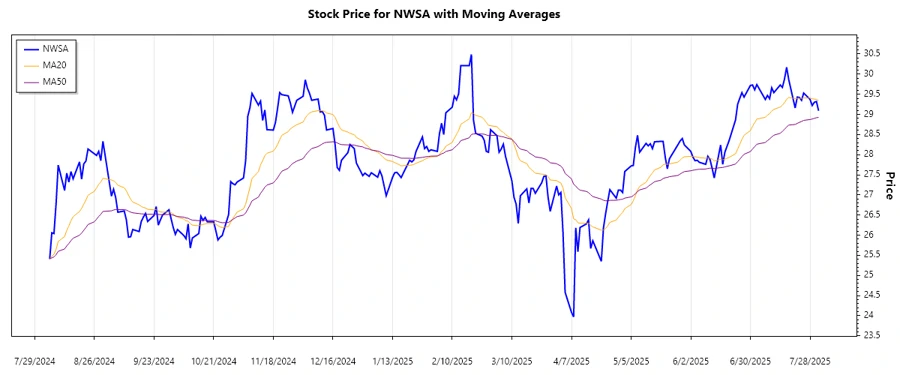
The analysis of the recent data reveals a nuanced market behavior for News Corporation's stock. Let's delve into the EMA calculations to study the underlying trend.
| Date | Close Price | Trend |
|---|---|---|
| 2025-08-01 | 29.09 | ▲ Uptrend |
| 2025-07-31 | 29.32 | ▲ Uptrend |
| 2025-07-30 | 29.30 | ▲ Uptrend |
| 2025-07-29 | 29.22 | ▲ Uptrend |
| 2025-07-28 | 29.37 | ▲ Uptrend |
| 2025-07-25 | 29.53 | ▲ Uptrend |
| 2025-07-24 | 29.35 | ▲ Uptrend |
Over the recent period, the EMA20 is above the EMA50, indicating a prevailing upward trend with positive momentum in the stock's price. This can be seen as a bullish signal for potential investors.
Support and Resistance
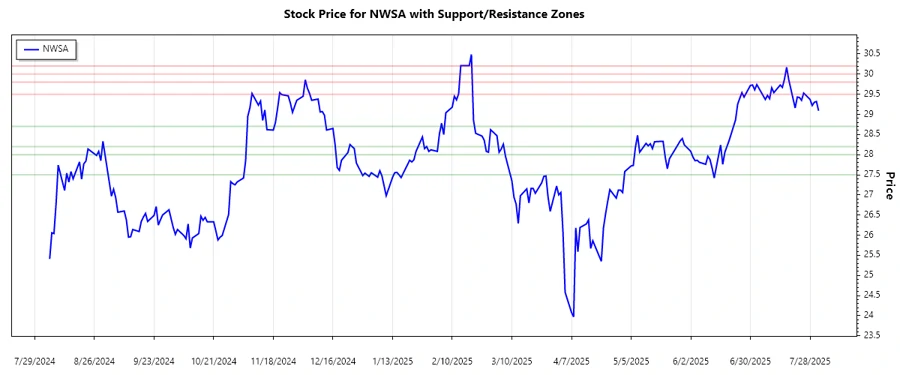
The following support and resistance zones have been identified based on the latest price data.
| Zone Type | From | To |
|---|---|---|
| Support | 27.50 | 28.00 |
| Support | 28.20 | 28.70 |
| Resistance | 29.50 | 29.80 |
| Resistance | 30.00 | 30.20 |
The current price is approaching the resistance zone of 29.50 - 29.80, and a breakthrough beyond this could imply strength in the current uptrend.
Conclusion
The recent analysis of NWSA stock data indicates a rising trend trajectory with potential upside if resistance levels at 29.50 - 29.80 are breached. It presents an opportunity, albeit with caution against any possible reversal should the stock fail to surpass its resistance zones. Investors should also monitor the broader market and industry news impacting News Corporation for complementary insights. Overall, the technical signals are skewing bullish, providing a reasonably optimistic outlook for the stock.
Smart Data Insight
Master the Perfect Entry & Exit for this Stock
Don't leave your profits to chance. Historically, this stock follows specific seasonal patterns that institutional traders use to maximize returns.
- ✅ Identify the "Golden Buying Window"
- ✅ Avoid high-risk correction cycles
- ✅ Backtested data from the last 20+ years