September 02, 2025 a 09:03 am
NVR: Trend and Support & Resistance Analysis - NVR, Inc.
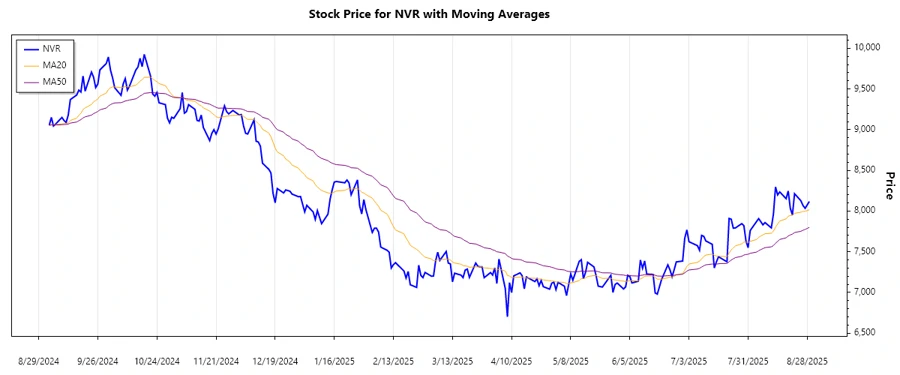
NVR, Inc. has shown a period of both volatility and range-bound movement within the analyzed months. The company's performance in the homebuilding sector, along with the mortgage services provided, could be reflected in the stock price variations. An investor should consider both the broader market influences and specific sector trends when analyzing the stock. Recent close pricing indicates potential shifts worth monitoring closely.
Trend Analysis
| Date | Closing Price | Trend |
|---|---|---|
| 2025-08-29 | 8117.65 | ▲ Upward |
| 2025-08-28 | 8074.80 | ▲ Upward |
| 2025-08-27 | 8033.82 | ▲ Upward |
| 2025-08-26 | 8068.25 | ▲ Upward |
| 2025-08-25 | 8126.71 | ▲ Upward |
| 2025-08-22 | 8212.81 | ▲ Upward |
| 2025-08-21 | 7953.90 | ▼ Downward |
Analyzing the data, we observe a dominant upward trend indicated by EMA20 consistently above EMA50. The recent closures are reflective of this positive trajectory, with brief fluctuations.
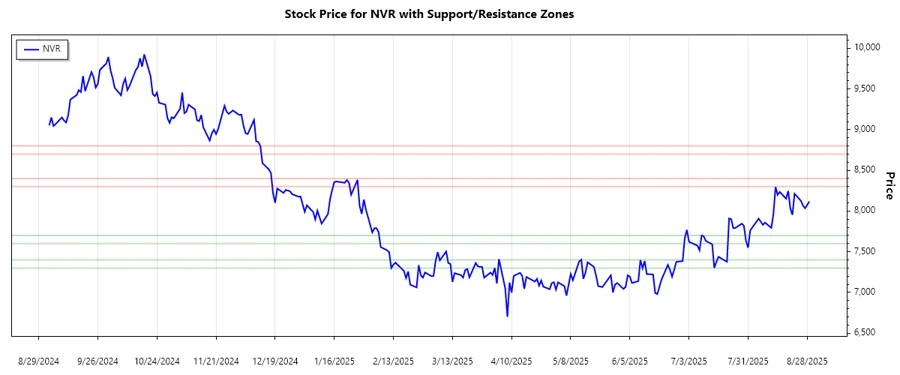
Support and Resistance
| Zone Type | From | To |
|---|---|---|
| Support Zone 1 | 7300 | 7400 |
| Support Zone 2 | 7600 | 7700 |
| Resistance Zone 1 | 8300 | 8400 |
| Resistance Zone 2 | 8700 | 8800 |
The current price lies near a resistance zone, presenting potential for either a breakout or a pullback based on trading momentum.
Conclusion
NVR, Inc.'s stock has largely trended upward, supported by sector growth and strategic positioning within the real estate market. Analyzing the support and resistance levels, an investor should watch for potential breakouts, with significant gains continuing the upward momentum. Risks include market volatility and sector-specific downturns. Thus, it is critical for investors to stay informed of broader market conditions as well as internal business performance metrics.
Smart Data Insight
Master the Perfect Entry & Exit for this Stock
Don't leave your profits to chance. Historically, this stock follows specific seasonal patterns that institutional traders use to maximize returns.
- ✅ Identify the "Golden Buying Window"
- ✅ Avoid high-risk correction cycles
- ✅ Backtested data from the last 20+ years