January 09, 2026 a 04:44 pm
NVR: Fibonacci Analysis - NVR, Inc.
NVR, Inc. has shown a notable trend in the past months, reflecting its responsiveness to the housing market's dynamics. The company's focus on homebuilding and mortgage banking allows it to capitalize on varying demands, with strategic operations across multiple states. However, market volatility and interest rates remain critical factors influencing its stock trend.
Fibonacci Analysis
This section analyzes NVR, Inc.'s stock trend using Fibonacci retracement, which helps identify potential support and resistance levels. Over the analyzed period, an upward trend was dominant.
| Start Date | End Date | High (Price & Date) | Low (Price & Date) |
|---|---|---|---|
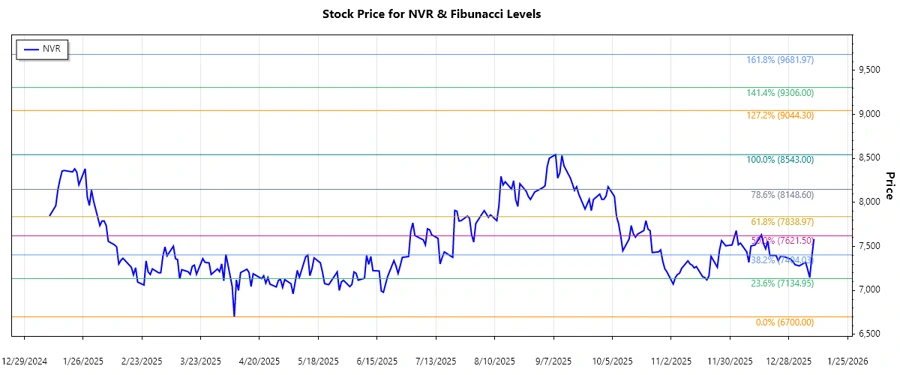
| 2025-08-11 | 2026-01-09 | $8543 - 2025-09-08 | $6700 - 2025-04-08 |
| Fibonacci Level | Price Level |
|---|---|
| 0.236 | $7369.13 |
| 0.382 | $7647.72 |
| 0.5 | $7921.50 |
| 0.618 | $8195.28 |
| 0.786 | $8512.97 |
The current NVR stock price is $7584.995, which places it in the retracement zone of 0.236. This indicates a potential area of support, with further observation needed to confirm if a reversal or continuation in trend will occur.
The image below provides a visual representation of these key levels.
Conclusion
NVR, Inc. shows resilience as a key player in the homebuilding sector, with its stock performance closely tied to macroeconomic indicators and consumer confidence. With current price levels just above a key retracement level, the next move will be pivotal. A breakthrough might suggest renewed momentum towards previous highs, while a reverse may see support tested again. On the risk side, economic downturns and increased interest rates could inhibit recovery.
Smart Data Insight
Master the Perfect Entry & Exit for this Stock
Don't leave your profits to chance. Historically, this stock follows specific seasonal patterns that institutional traders use to maximize returns.
- ✅ Identify the "Golden Buying Window"
- ✅ Avoid high-risk correction cycles
- ✅ Backtested data from the last 20+ years