October 04, 2025 a 10:15 am
NVR: Fibonacci Analysis - NVR, Inc.
NVR, Inc. operates as a significant player in the homebuilding sector in the United States. With a steady growth trajectory, NVR has demonstrated resilience in varying market conditions. Given recent price dynamics, the company has displayed a notable ability to adapt and maintain its market position, making it an intriguing prospect for investors interested in the housing market.
Fibonacci Analysis
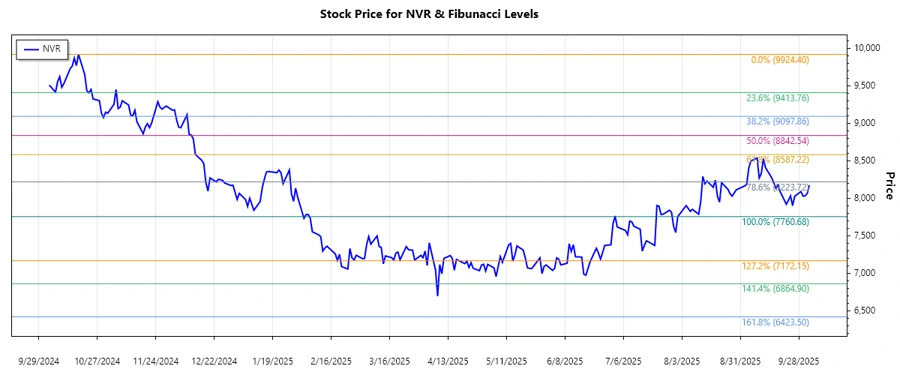
Based on the historical price data, a dominant downtrend was identified from October 18, 2024, to October 3, 2025. The high was at 9924.4 on October 18, 2024, and the low at 7760.68 on August 1, 2025. With the current price at 8178, we find a potential retracement in the 0.236 area.
| Information | Details |
|---|---|
| Start Date | 2024-10-18 |
| End Date | 2025-10-03 |
| High (Oct 18, 2024) | 9924.4 |
| Low (Aug 1, 2025) | 7760.68 |
| Current Price | 8178 |
| Fibonacci 0.236 | 8425.12 |
| Fibonacci 0.382 | 8826.44 |
| Fibonacci 0.5 | 8842.54 |
| Fibonacci 0.618 | 9158.63 |
| Fibonacci 0.786 | 9506.35 |
The current price is within the 0.236 retracement zone, indicating potential support. This level may act as a minor support, suggesting a possible consolidation phase before any further price movements.
Conclusion
The housing sector's dynamics continue to mold NVR, Inc.'s performance, influenced by factors such as interest rates and economic climate. The identification of a retracement within the 0.236 Fibonacci level could offer a support zone that analysts should watch closely. As NVR navigates through the volatile landscape, understanding Fibonacci retracement levels may provide valuable insight into future price behavior, offering strategic points for potential buying opportunities. However, investors must weigh these opportunities against broader market pressures and company-specific factors that could impact the stock’s trajectory.
Smart Data Insight
Master the Perfect Entry & Exit for this Stock
Don't leave your profits to chance. Historically, this stock follows specific seasonal patterns that institutional traders use to maximize returns.
- ✅ Identify the "Golden Buying Window"
- ✅ Avoid high-risk correction cycles
- ✅ Backtested data from the last 20+ years