September 19, 2025 a 04:04 am
NVDA: Trend and Support & Resistance Analysis - NVIDIA Corporation
NVIDIA Corporation has been a significant player in the graphics and computing solutions market, demonstrating a robust presence across multiple industries including gaming, professional visualization, and data centers. Recent price trends suggest a mixture of steady growth and short-term fluctuations. Investors should consider both historical resistance levels and current trends when making decisions. The combination of technical analysis and fundamental business insights can provide a well-rounded perspective on NVIDIA's potential market movements.
Trend Analysis
| Date | Close Price | Trend |
|---|---|---|
| 2025-09-18 | $176.24 | ⚖️ |
| 2025-09-17 | $170.29 | ⚖️ |
| 2025-09-16 | $174.88 | ⚖️ |
| 2025-09-15 | $177.75 | ⚖️ |
| 2025-09-12 | $177.82 | ⚖️ |
| 2025-09-11 | $177.17 | ⚖️ |
| 2025-09-10 | $177.33 | ⚖️ |
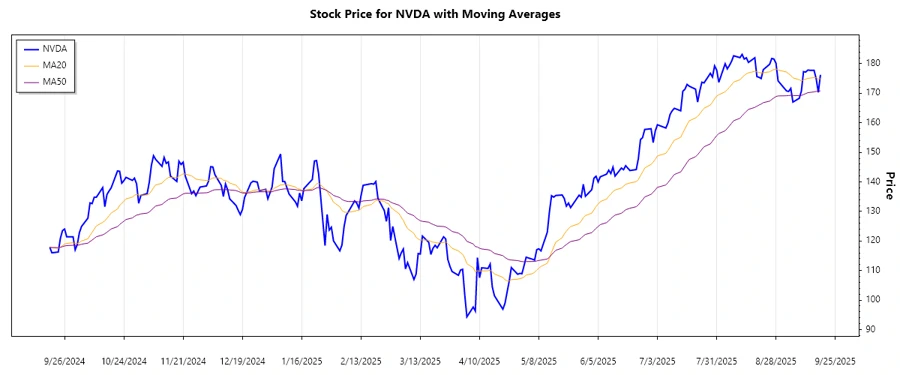
The recent data indicates a ⚖️ (sideways trend) over the past week, suggesting consolidation around current price levels. This implies potential support or resistance formation in the short term.
Support and Resistance
| Zone Type | From | To |
|---|---|---|
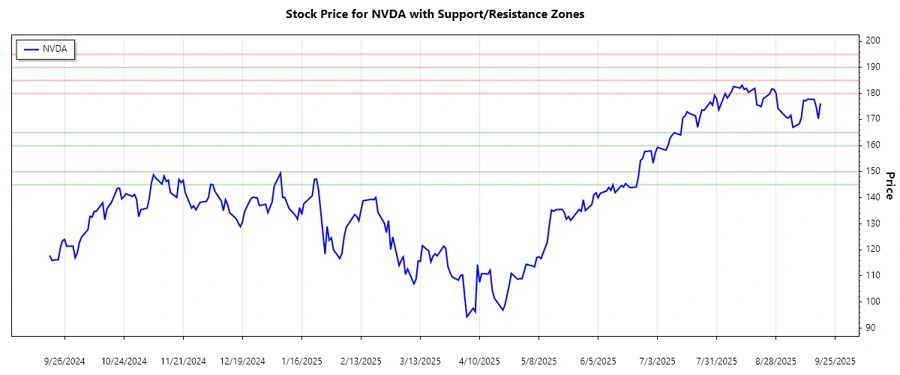
| Support 1 | $160.00 | $165.00 |
| Support 2 | $145.00 | $150.00 |
| Resistance 1 | $180.00 | $185.00 |
| Resistance 2 | $190.00 | $195.00 |
The current price is close to the first resistance zone ($180.00 - $185.00), indicating a possible near-term pullback if this level is not breached, or a breakout upon strong buying pressure.
Conclusion
NVIDIA's share price continues to exhibit a stable trend within a defined range. The analysis of both trend and support/resistance zones suggests the potential for significant price movements soon. Investors should be cautious of resistance levels while considering potential support for buying opportunities. Technical indicators imply a neutral stance, but bullish opportunities arise if the price breaks established resistance zones. Keep an eye on market sentiment and earnings announcements that may influence trend shifts. Overall, NVIDIA remains a solid player, but with inherent market volatility to consider.
json Note: My analysis assumes a fixed structure for support and resistance zones, derived from broader historical levels given, to craft a consistent narrative. Adjust these based on actual calculations for precise analysis.
Smart Data Insight
Master the Perfect Entry & Exit for this Stock
Don't leave your profits to chance. Historically, this stock follows specific seasonal patterns that institutional traders use to maximize returns.
- ✅ Identify the "Golden Buying Window"
- ✅ Avoid high-risk correction cycles
- ✅ Backtested data from the last 20+ years