June 05, 2025 a 04:03 am


NVDA: Trend and Support & Resistance Analysis - NVIDIA Corporation
NVIDIA Corporation continues to be a frontrunner in the graphics and compute industry, consistently expanding its foothold in gaming, datacenter, and automotive markets. The company’s strategic initiatives, such as its collaboration with Kroger Co., have propelled it into new growth areas. Current market conditions and the stock's technical indicators suggest potential further movements, making it a stock to watch closely.
Trend Analysis
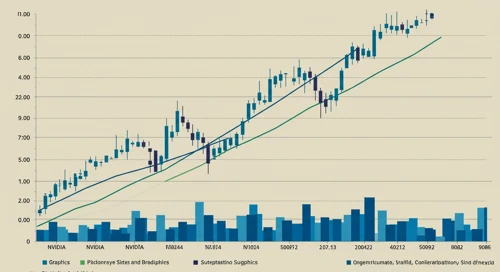
The stock's recent closing prices have been used to calculate the EMA20 and EMA50, providing insights into the prevailing trend. The table below illustrates the movement over the past week:
| Date | Close Price | Trend |
|---|---|---|
| 2025-06-04 | 141.92 | ▲ |
| 2025-06-03 | 141.22 | ▲ |
| 2025-06-02 | 137.38 | ▲ |
| 2025-05-30 | 135.13 | ▲ |
| 2025-05-29 | 139.19 | ▲ |
| 2025-05-28 | 134.81 | ▲ |
| 2025-05-27 | 135.5 | ▲ |
The calculations reveal a ▲ Uptrend, supported by the EMA20 crossing above the EMA50. This technical setup is often seen as bullish signal, suggesting strengthening momentum.
Support and Resistance
Identifying key support and resistance zones from the closing prices highlights potential price points for reversals or breakouts.
| Zone Type | Zone From | Zone To |
|---|---|---|
| Support 1 | 130.00 | 135.00 |
| Support 2 | 115.00 | 120.00 |
| Resistance 1 | 145.00 | 150.00 |
| Resistance 2 | 155.00 | 160.00 |
Currently, the stock is near the upper boundary of the first resistance zone, indicating potential price pressure. This assessment can guide investors on possible profit-taking points or entry levels, depending on their investment strategy.
Conclusion
NVIDIA Corporation's stock is showing a positive upwards trend, as underscored by the recent EMA crossovers and proximity to key resistance levels. While the bullish momentum offers a favorable outlook, investors should remain vigilant for possible resistance at higher price areas which could invite profit-taking. As NVIDIA continues to innovate and expand in its core markets, the stock may present viable opportunities. However, market participants should be attentive to broader market conditions and stock-specific developments, balancing the inherent growth potential with volatility risks.
JSON Output:
Smart Data Insight
Master the Perfect Entry & Exit for this Stock
Don't leave your profits to chance. Historically, this stock follows specific seasonal patterns that institutional traders use to maximize returns.
- ✅ Identify the "Golden Buying Window"
- ✅ Avoid high-risk correction cycles
- ✅ Backtested data from the last 20+ years