May 06, 2026 a 06:00 pm

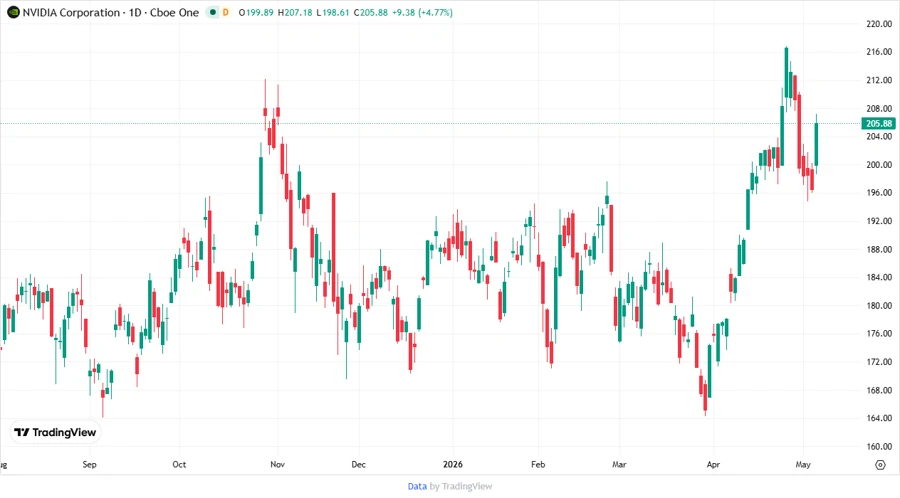
NVDA: Fundamental Ratio Analysis - NVIDIA Corporation
NVIDIA Corporation stands as a powerhouse in the tech industry, providing advanced graphics and compute solutions. With a global reach, its products range from GPUs to AI platforms. Holding a substantial market position, NVIDIA showcases a fundamental strength with certain areas of improvement.
Fundamental Rating
NVIDIA holds a solid rating of A- with a strong overall score. Key metrics reflect its robust performance in profitability and valuation.
| Category | Score | Score Visualization |
|---|---|---|
| Discounted Cash Flow | 4 | |
| Return on Equity | 5 | |
| Return on Assets | 5 | |
| Debt to Equity | 3 | |
| Price to Earnings | 2 | |
| Price to Book | 1 |
Historical Rating
The historical data reflects consistent strength in fundamental metrics, though improvement in valuation scores is noted.
| Date | Overall | DCF | ROE | ROA | D/E | P/E | P/B |
|---|---|---|---|---|---|---|---|
| 2026-05-06 | 4 | 4 | 5 | 5 | 3 | 2 | 1 |
| Previous | 0 | 4 | 5 | 5 | 3 | 2 | 1 |
Analyst Price Targets
Analysts have set ambitious price targets for NVIDIA, reflecting high expectations with an industry consensus to buy.
| High | Low | Median | Consensus |
|---|---|---|---|
| $400 | $140 | $275 | $275.74 |
Analyst Sentiment
The sentiment from analysts indicates a strong conviction towards buying NVIDIA shares, with limited selling pressure.
| Recommendation | Count | Distribution |
|---|---|---|
| Strong Buy | 2 | |
| Buy | 58 | |
| Hold | 16 | |
| Sell | 3 | |
| Strong Sell | 0 |
Conclusion
NVIDIA Corporation's strong market position and innovative product offerings support its fundamental rating and analyst confidence. While its profitability metrics are commendable, valuation aspects could benefit from improvement. The strong buy consensus among analysts reflects positive long-term growth potential tempered by current market conditions and competition within the semiconductor industry. Investors should weigh potential market volatility against promising technological advancements. Overall, NVIDIA presents a compelling investment opportunity with some inherent risks.
Smart Data Insight
Master the Perfect Entry & Exit for this Stock
Don't leave your profits to chance. Historically, this stock follows specific seasonal patterns that institutional traders use to maximize returns.
- ✅ Identify the "Golden Buying Window"
- ✅ Avoid high-risk correction cycles
- ✅ Backtested data from the last 20+ years