
July 18, 2026 a 12:46 pm


NVDA: Dividend Analysis - NVIDIA Corporation
NVIDIA Corporation presents a compelling dividend profile with a yield of 0.13% and a robust history of 15 years. While the yield appears modest, the company's consistent dividend growth illustrates a focus on enhancing shareholder value. The absence of any recent cuts or suspensions signals stability.
📊 Overview
NVIDIA operates in the semiconductor sector, presenting a dividend yield of 0.13%. Its current dividend per share stands at approximately $0.04, with an impressive dividend history spanning 15 years. The firm has not experienced any recent dividend cuts or suspensions, emphasizing its commitment to steady shareholder returns.
| Metric | Value |
|---|---|
| Sector | Semiconductor |
| Dividend yield | 0.13% |
| Current dividend per share | 0.04 USD |
| Dividend history | 15 years |
| Last cut or suspension | None |
📉 Dividend History
Maintaining a consistent dividend history over 15 years, NVIDIA has proven its dedication to returning capital to shareholders. This historical stability is pivotal for income-focused investors willing to obtain consistent payouts.
| Year | Dividend Per Share (USD) |
|---|---|
| 2026 | 0.26 |
| 2025 | 0.04 |
| 2024 | 0.034 |
| 2023 | 0.016 |
| 2022 | 0.016 |
📈 Dividend Growth
NVIDIA's dividend growth over the past years highlights its commitment to increasing shareholder returns. This growth is indicative of the company’s ability to generate increasing cash flows and mirrors its strong business fundamentals.
| Time | Growth |
|---|---|
| 3 years | 35.72% |
| 5 years | 20.11% |
The average dividend growth is 20.11% over 5 years. This shows moderate but steady dividend growth.
✅ Payout Ratio
Payout ratios indicate the proportion of earnings and free cash flow allocated to dividends, reflecting sustainability. NVIDIA's EPS payout ratio is 60.84%, and the FCF payout ratio is 81.33%. Both ratios suggest a cautious but ample approach towards maintaining dividend payments amidst growing earnings.
| Key Figure | Ratio |
|---|---|
| EPS-based | 60.84% |
| Free cash flow-based | 81.33% |
The current figures demonstrate a manageable distribution relative to earnings and cash flow, confirming a secure dividend policy.
📉 Cashflow & Capital Efficiency
NVIDIA's cash flow and capital efficiency metrics portray its financial health. A free cash flow yield of 2.42% and a CAPEX to operating cash flow ratio around 5.23% validate capital discipline and efficient cash utilization, crucial to funding dividends and investments.
| Metric | 2026 | 2025 | 2024 |
|---|---|---|---|
| Free Cash Flow Yield | 2.13% | 2.09% | 1.75% |
| Earnings Yield | 2.64% | 2.51% | 1.93% |
| CAPEX to Operating Cash Flow | 5.88% | 5.05% | 3.81% |
| Stock-based Compensation to Revenue | 2.95% | 3.63% | 5.83% |
| Free Cash Flow / Operating Cash Flow Ratio | 94.12% | 94.95% | 96.19% |
The data illustrates strong cash generation, supporting further investment while maintaining dividend payouts.
📊 Balance Sheet & Leverage Analysis
Analyzing NVIDIA's balance sheet, the leverage ratios, such as a debt-to-equity ratio of 0.07, imply prudent debt management. Such financial strategies ensure operational flexibility and a robust capital structure.
| Metric | 2026 | 2025 | 2024 |
|---|---|---|---|
| Debt-to-Equity | 0.07 | 0.13 | 0.26 |
| Debt-to-Assets | 0.05 | 0.09 | 0.17 |
| Debt-to-Capital | 0.07 | 0.11 | 0.20 |
| Net Debt to EBITDA | -0.002 | 0.02 | 0.11 |
| Current Ratio | 3.44 | N/A | N/A |
| Quick Ratio | 3.24 | 3.88 | 3.67 |
| Financial Leverage | 1.31 | 1.40 | 1.53 |
The metrics demonstrate NVIDIA's conservative approach to leveraging its financial resources, maintaining an impressively low debt profile.
📉 Fundamental Strength & Profitability
Examining NVIDIA's fundamentals reveals robust profitability margins, with a net profit margin approaching 55.6% in 2026 and ROE levels consistently above 69%. Such metrics indicate a strong capacity to generate profits from shareholder equity and company assets.
| Metric | 2026 | 2025 | 2024 |
|---|---|---|---|
| Return on Equity | 76.33% | 91.87% | 69.24% |
| Return on Assets | 58.06% | 65.30% | 45.28% |
| Net Margin | 55.60% | 55.85% | 48.85% |
| EBIT Margin | 65.62% | 64.58% | 55.93% |
| EBITDA Margin | 66.94% | 66.01% | 58.41% |
| Gross Margin | 71.07% | 74.99% | 72.72% |
| R&D to Revenue | 8.22% | 9.90% | 14.24% |
NVIDIA’s operating metrics underline an extraordinary capacity for revenue generation and margin expansion, assuring continued competitiveness.
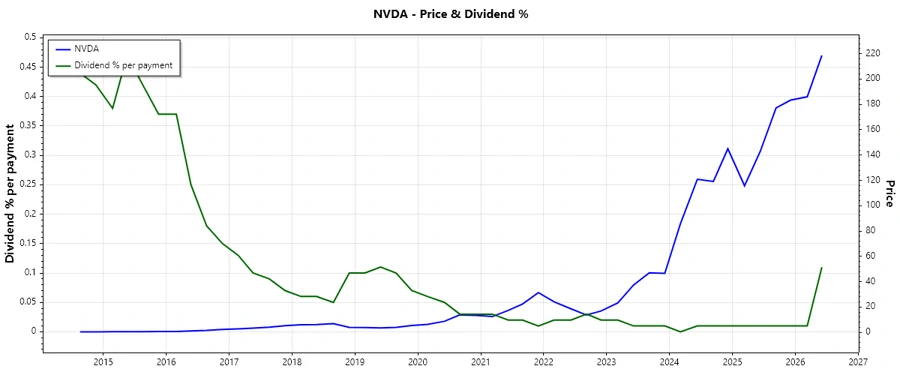
📈 Price Development
🗣️ Dividend Scoring System
| Category | Score (1-5) | Score Bar |
|---|---|---|
| Dividend yield | 2 | |
| Dividend Stability | 5 | |
| Dividend growth | 4 | |
| Payout ratio | 4 | |
| Financial stability | 5 | |
| Dividend continuity | 5 | |
| Cashflow Coverage | 4 | |
| Balance Sheet Quality | 5 |
Total Score: 34/40
🔍 Rating
The dividend profile for NVIDIA Corporation is strong, with consistent growth and excellent stability in dividends over many years. Given its sturdy financials and commitment to maintaining robust returns, NVIDIA stands as an attractive opportunity for dividend-focused investors. This stock holds a strong appeal for a diversified portfolio aiming to balance growth and income.
Smart Data Insight
Master the Perfect Entry & Exit for this Stock
Don't leave your profits to chance. Historically, this stock follows specific seasonal patterns that institutional traders use to maximize returns.
- ✅ Identify the "Golden Buying Window"
- ✅ Avoid high-risk correction cycles
- ✅ Backtested data from the last 20+ years