June 26, 2026 a 03:30 am

NVDA: Dividend Analysis - NVIDIA Corporation
As a leading player in the semiconductor industry, NVIDIA's dividend profile reflects its strategic balance between capital growth and shareholder retrun. Despite a modest dividend yield, the company demonstrates strong dividend growth and a robust payout ratio, indicating healthy cash flow management and a commitment to returning value to its shareholders. An examination of its historical performance shows resilience and the potential for future dividend consistency, making NVIDIA an interesting prospect for dividend-focused investors. However, potential investors should carefully consider both market risks and technological advancements impacting this sector.
Overview 📊
| Key Metric | Value |
|---|---|
| Sector | Semiconductors |
| Dividend Yield | 0.13 % |
| Current Dividend per Share | 0.04 USD |
| Dividend History | 15 years |
| Last Cut or Suspension | None |
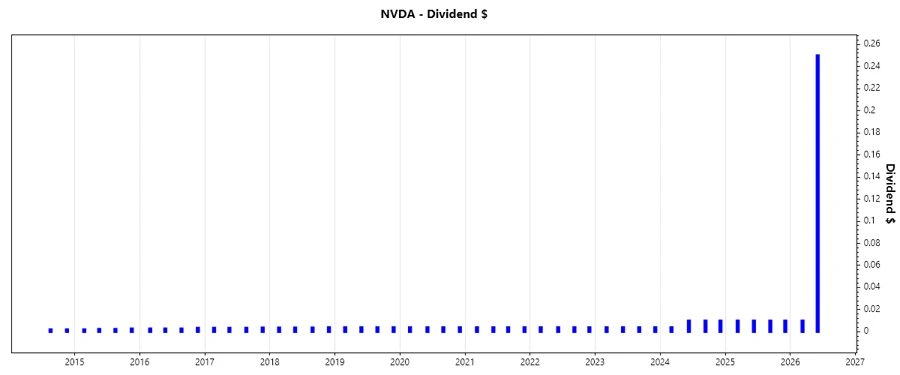
Dividend History 📈
NVIDIA's dividend history showcases a steady course of incremental increases. This is crucial for income investors who seek predictability and security in their dividend returns. The company's ability to maintain and potentially raise dividends, despite varying market conditions, speaks to its financial robustness and strategic foresight.
| Year | Dividend per Share (USD) |
|---|---|
| 2026 | 0.26 |
| 2025 | 0.04 |
| 2024 | 0.034 |
| 2023 | 0.016 |
| 2022 | 0.016 |
Dividend Growth 📉
Dividend growth rates over recent years have shown a considerable increase which can be appealing to growth-oriented income investors. The company's capability to grow dividends suggests potential for future upscale and value retention.
| Time | Growth |
|---|---|
| 3 years | 35.72 % |
| 5 years | 20.11 % |
The average dividend growth is 20.11 % over 5 years. This shows moderate but steady dividend growth.
Payout Ratio ✅
Payout ratios serve as a solid indicator of how much of the company’s earnings are returned to shareholders, with consideration of sustainable growth. NVIDIA's payout ratio analysis displays a balance that potentially assures dividend safety and scope for reinvestment.
| Key Figure Ratio | Value |
|---|---|
| EPS-based | 60.84 % |
| Free Cash Flow-based | 81.33 % |
The EPS-based payout ratio of 60.84 % and FCF-based ratio of 81.33 % indicate a complex combination where the earnings secure dividends; however, there is room for careful management to maintain sustainable payout growth.
Cashflow & Capital Efficiency 🏦
Strong cash flow management and capital efficiency are imperative for maintaining dividend payouts and investing in growth. NVIDIA exhibits impressive capital efficiency, suggesting effective utilization of resources.
| Metric | 2026 | 2025 | 2024 |
|---|---|---|---|
| Free Cash Flow Yield | 2.13 % | 2.09 % | 1.75 % |
| Earnings Yield | 2.64 % | 2.51 % | 1.93 % |
| CAPEX to Operating Cash Flow | 5.88 % | 5.05 % | 3.81 % |
| Stock-based Compensation to Revenue | 2.96 % | 3.63 % | 5.83 % |
| Free Cash Flow / Operating Cash Flow Ratio | 94.12 % | 94.95 % | 96.19 % |
Consistent and healthy free cash flow coverage underscores a well-capitalized company with adequate capacity to sustain and increase dividends whilst supporting strategic growth initiatives.
Balance Sheet & Leverage Analysis 📊
Analysis of NVIDIA's balance sheet highlights its strong liquidity position and maintains leverage ratios in a range that signals financial solvency, critical in financial downturns.
| Metric | 2026 | 2025 | 2024 |
|---|---|---|---|
| Debt-to-Equity | 0.073 | 0.129 | 0.257 |
| Debt-to-Assets | 0.055 | 0.092 | 0.168 |
| Debt-to-Capital | 0.068 | 0.115 | 0.205 |
| Net Debt to EBITDA | -0.002 | 0.020 | 0.106 |
| Current Ratio | 3.441 | 4.440 | 4.171 |
| Quick Ratio | 3.240 | 3.881 | 3.674 |
| Financial Leverage | 1.315 | 1.407 | 1.529 |
With comparatively low levels of debt, NVIDIA mitigates financial risk, enabling flexibility and resilience in economic instability scenarios.
Fundamental Strength & Profitability 📈
NVIDIA’s fundamentally strong, profitability metrics indicate a company that is executing its business model effectively, generating high returns on both assets and equity.
| Metric | 2026 | 2025 | 2024 |
|---|---|---|---|
| Return on Equity | 76.33 % | 91.87 % | 69.24 % |
| Return on Assets | 58.06 % | 65.30 % | 45.28 % |
| Margins: Net | 55.60 % | 55.85 % | 48.85 % |
| Margins: EBIT | 65.62 % | 64.58 % | 55.93 % |
| Margins: EBITDA | 66.94 % | 66.01 % | 58.41 % |
| Margins: Gross | 71.07 % | 74.99 % | 72.72 % |
| Research & Development to Revenue | 8.22 % | 9.90 % | 14.24 % |
NVIDIA’s high profitability ratios reflect the company's core strengthening propensity within operational performance, leading to increased investor confidence and compelling market competitiveness.
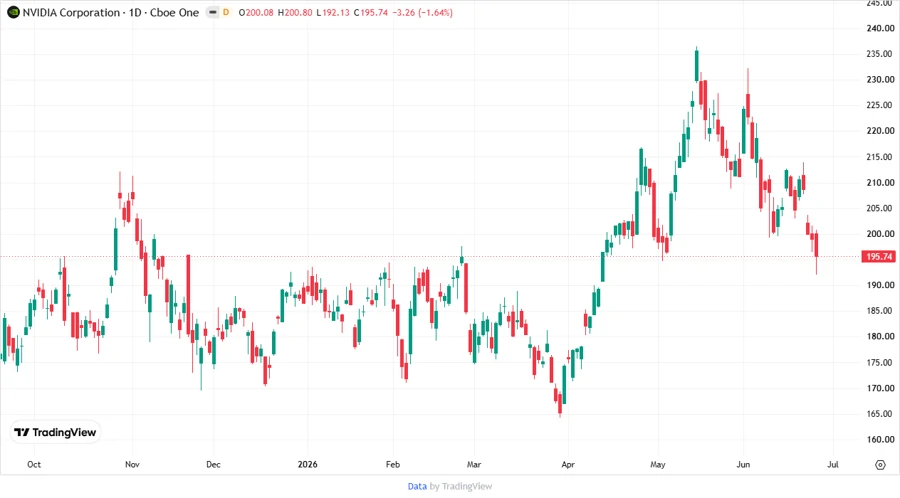
Price Development 🗣️
Dividend Scoring System 🔢
| Category | Score | Score Bar |
|---|---|---|
| Dividend Yield | 2 | |
| Dividend Stability | 5 | |
| Dividend Growth | 4 | |
| Payout Ratio | 4 | |
| Financial Stability | 5 | |
| Dividend Continuity | 5 | |
| Cashflow Coverage | 5 | |
| Balance Sheet Quality | 5 |
Total Score: 35/40
Rating 🏆
Overall, NVIDIA Corporation presents a compelling dividend profile characterized by its commitment to stable and increasing payouts, backed by strong financial fundamentals. This positions NVIDIA as a desirable choice for long-term investors seeking both growth and income. However, potential investors should remain vigilant of market and technological shifts within the semiconductor industry that could impact future performance.
Smart Data Insight
Master the Perfect Entry & Exit for this Stock
Don't leave your profits to chance. Historically, this stock follows specific seasonal patterns that institutional traders use to maximize returns.
- ✅ Identify the "Golden Buying Window"
- ✅ Avoid high-risk correction cycles
- ✅ Backtested data from the last 20+ years