March 15, 2026 a 11:31 am

NVDA: Dividend Analysis - NVIDIA Corporation
NVIDIA Corporation presents a potential dividend opportunity, albeit with a relatively modest yield. Investors may find value in NVIDIA's consistent dividend history, while potential growth in dividends adds further attractiveness for long-term stakeholders. The company's financial metrics highlight a resilient business model through technical innovation and strategic capital allocation.
📊 Overview
NVIDIA operates in the cutting-edge technology sector. The company offers a dividend yield of 0.02% with a current dividend per share of 0.04 USD. It has a commendable dividend history spanning 15 years, with no recent cuts or suspensions. This signals a reliable income stream for investors.
| Sector | Dividend Yield (%) | Current Dividend Per Share (USD) | Dividend History (Years) | Last Cut or Suspension |
|---|---|---|---|---|
| Technology | 0.02 | 0.04 | 15 | None |
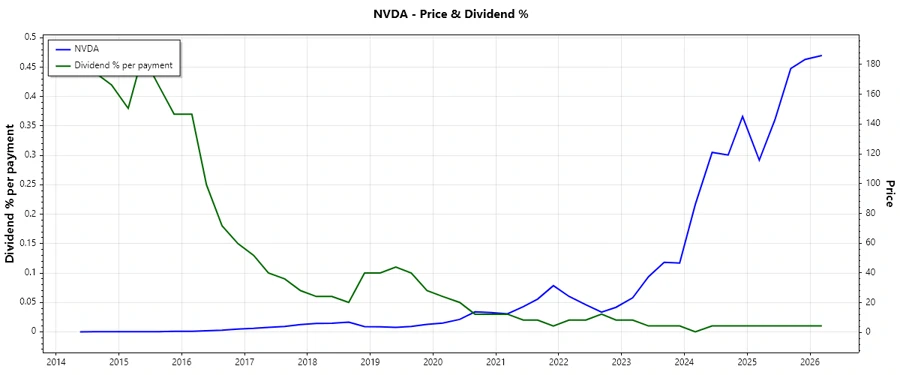
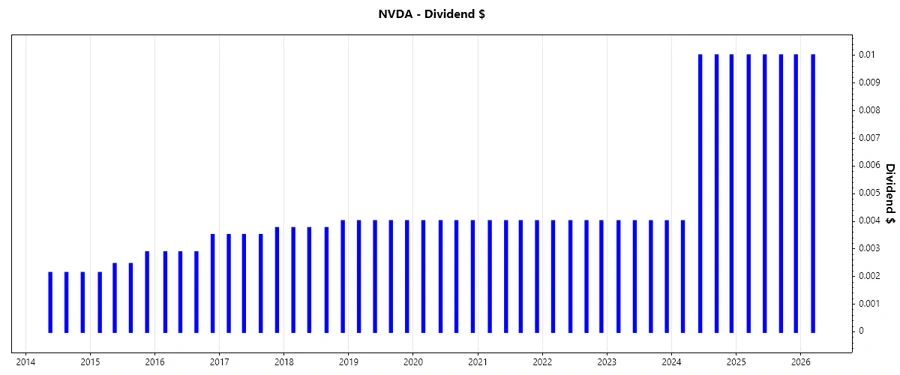
🗣️ Dividend History
Maintaining a consistent dividend payout over the years is vital as it demonstrates the company's commitment to returning value to shareholders. An uninterrupted dividend history bolsters investor confidence and can contribute to attracting income-focused investors.
| Year | Dividend Per Share (USD) |
|---|---|
| 2026 | 0.01 |
| 2025 | 0.04 |
| 2024 | 0.034 |
| 2023 | 0.016 |
| 2022 | 0.016 |
📈 Dividend Growth
The dividend growth indicates potential future income increases, which can be an attractive aspect for long-term investors seeking income generation. Strong historical growth can overshadow a low current yield by providing higher future returns.
| Time | Growth |
|---|---|
| 3 years | 35.72 % |
| 5 years | 20.11 % |
The average dividend growth is 20.11 % over 5 years. This shows moderate but steady dividend growth.
🧮 Payout Ratio
The payout ratio is critical in assessing whether the company is maintaining a sustainable dividend. A lower ratio often suggests room for dividend increases, while a higher ratio may indicate limited growth potential or risk of dividend cuts in crises.
| Key Figure | Ratio |
|---|---|
| EPS-based | 81.12 % |
| Free cash flow-based | 100.75 % |
The payout ratios of 81.12 % (EPS) and 100.75 % (FCF) point to a high payout lifestyle. While covered by earnings, the company floats to the edge of its FCF, indicating limited expansion of dividends without income growth.
💵 Cashflow & Capital Efficiency
Strong cash flow generation is essential for ongoing operations and to sustain dividend payouts. Efficiency metrics help in understanding capital allocation strategy and how effectively a company reinvests income.
| Metric | 2026 | 2025 | 2024 |
|---|---|---|---|
| Free Cash Flow Yield | 2.13 % | 2.09 % | 1.75 % |
| Earnings Yield | 2.65 % | 2.51 % | 1.93 % |
| CAPEX to Operating Cash Flow | 5.88 % | 5.05 % | 3.81 % |
| Stock-based Compensation to Revenue | 2.96 % | 3.63 % | 5.83 % |
| Free Cash Flow / Operating Cash Flow Ratio | 94.12 % | 94.95 % | 96.19 % |
The cash flow ratios suggest solid cash generation with efficient capital management. The company maintains a high level of free cash flow relative to its operating income, indicating robust cash management and potential dividend coverage.
💳 Balance Sheet & Leverage Analysis
A strong balance sheet with disciplined leverage ensures a company can weather economic cycles, continue operations without financial distress, and meet dividend obligations, enhancing shareholder value.
| Metric | 2026 | 2025 | 2024 |
|---|---|---|---|
| Debt-to-Equity | 7.26 % | 12.95 % | 25.72 % |
| Debt-to-Assets | 5.52 % | 9.20 % | 16.82 % |
| Debt-to-Capital | 6.76 % | 11.46 % | 20.46 % |
| Net Debt to EBITDA | 0.56 % | 1.95 % | 10.61 % |
| Current Ratio | 3.91 | 4.44 | 4.17 |
| Quick Ratio | 3.24 | 3.88 | 3.67 |
| Financial Leverage | 1.31 | 1.41 | 1.53 |
NVIDIA exhibits sound financial stability with selectively managed leverage ratios conducive to operational flexibility. With robust current and quick ratios, the company is well-positioned to service debt and finance new investments.
💰 Fundamental Strength & Profitability
Fundamental strength reflects a company's ability to generate sustainable profits, aligning with investor expectations. Assessing profitability margins and R&D investment can yield insights into competitive positioning and innovative capacity.
| Metric | 2026 | 2025 | 2024 |
|---|---|---|---|
| Return on Equity | 76.33 % | 91.87 % | 69.24 % |
| Return on Assets | 58.06 % | 65.30 % | 45.28 % |
| Margins: Net | 55.60 % | 55.85 % | 48.85 % |
| EBIT | 65.62 % | 64.58 % | 55.93 % |
| EBITDA | 66.94 % | 66.01 % | 58.41 % |
| Gross | 71.06 % | 74.99 % | 72.72 % |
| Research & Development to Revenue | 8.57 % | 9.90 % | 14.24 % |
The company demonstrates impressive profitability metrics indicative of strong cost management and operational efficiency. Investment in R&D supports NVIDIA's strategic focus on innovation, providing a competitive edge over peers.
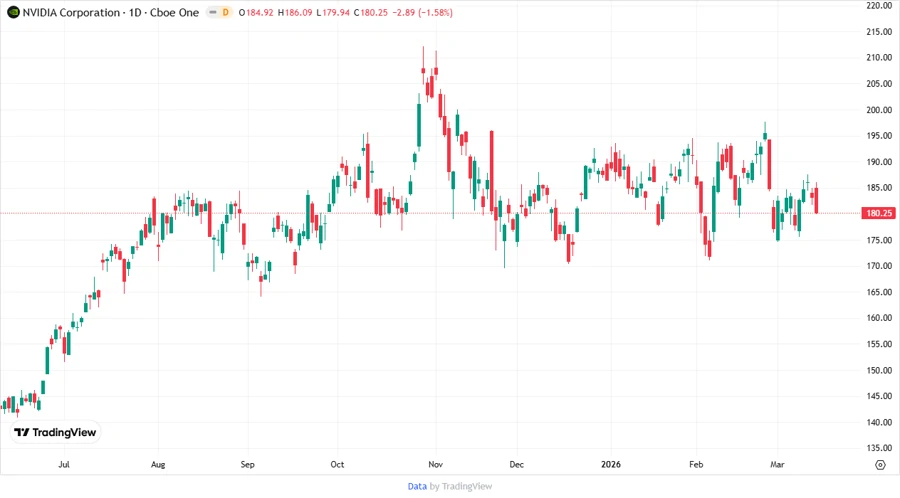
📉 Price Development
✅ Dividend Scoring System
| Criteria | Score | Score Bar |
|---|---|---|
| Dividend Yield | 2 | |
| Dividend Stability | 5 | |
| Dividend Growth | 3 | |
| Payout Ratio | 3 | |
| Financial Stability | 4 | |
| Dividend Continuity | 4 | |
| Cashflow Coverage | 4 | |
| Balance Sheet Quality | 5 |
Total Score: 30/40 Points
🔗 Rating
NVIDIA Corporation is a robust choice for investors seeking a blend of technological innovation and potential dividend income. While the yield may not appeal to traditional income investors, NVIDIA's stable and growing dividend history, coupled with strong financial performance, makes it an appealing candidate for those with a balanced investment strategy aligning with moderate growth.
Smart Data Insight
Master the Perfect Entry & Exit for this Stock
Don't leave your profits to chance. Historically, this stock follows specific seasonal patterns that institutional traders use to maximize returns.
- ✅ Identify the "Golden Buying Window"
- ✅ Avoid high-risk correction cycles
- ✅ Backtested data from the last 20+ years