August 10, 2025 a 11:31 am

NVDA: Dividend Analysis - NVIDIA Corporation
NVIDIA Corporation, being a key player in the tech industry, offers growth potential through its innovative technology solutions. Despite a modest dividend yield, its consistent dividend history and strong market presence underline its appeal to growth-oriented investors. The financial analysis illustrates its capacity to deliver dividends sustainably.
Overview 📊
This section provides an overview of NVIDIA Corporation's dividend profile, focusing on the essential metrics that reflect the company's dividend policy and market standing.
| Metric | Value |
|---|---|
| Sector | Technology |
| Dividend yield | 0.03% |
| Current dividend per share | 0.034 USD |
| Dividend history | 14 years |
| Last cut or suspension | None |
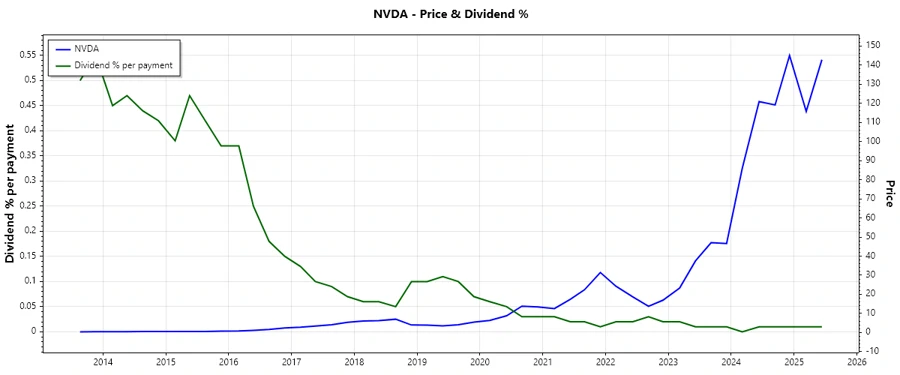
Dividend History 🗣️
Analyzing the dividend history provides insights into the reliability and consistency of the company's dividend payments. NVIDIA has demonstrated a steady dividend increase over the years, reinforcing investor confidence.
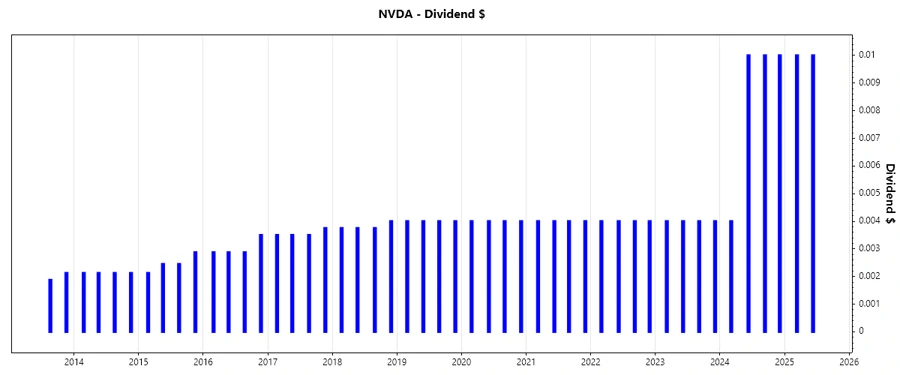
| Year | Dividend per share (USD) |
|---|---|
| 2025 | 0.02 |
| 2024 | 0.034 |
| 2023 | 0.016 |
| 2022 | 0.016 |
| 2021 | 0.016 |
Dividend Growth 📈
Understanding dividend growth is crucial for anticipating future income streams. NVIDIA's recent dividend growth trends indicate its commitment to rewarding shareholders while pursuing growth opportunities.
| Time | Growth |
|---|---|
| 3 years | 28.56% |
| 5 years | 16.27% |
The average dividend growth is 16.27% over 5 years. This shows moderate but steady dividend growth.
Payout Ratio 📉
Payout ratios offer insights into the sustainability of current dividend payments and the company's willingness to continue paying dividends in the future.
| Key figure | Ratio |
|---|---|
| EPS-based | 108.13% |
| Free cash flow-based | 115.00% |
The high EPS payout ratio of 108.13% suggests potential over-distribution, whereas the FCF payout ratio of 115.00% indicates a need for careful future dividend management.
Cashflow & Capital Efficiency ✅
This section provides insights into how efficiently the company is generating financial resources and deploying capital.
| Year | 2025 | 2024 | 2023 |
|---|---|---|---|
| Free Cash Flow Yield | 2.09% | 1.75% | 0.80% |
| Earnings Yield | 2.51% | 1.93% | 0.92% |
| CAPEX to Operating Cash Flow | 5.05% | 3.81% | 32.49% |
| Stock-based Compensation to Revenue | 3.63% | 5.83% | 10.04% |
| Free Cash Flow / Operating Cash Flow Ratio | 94.95% | 96.19% | 67.51% |
The data reflects strong cash flow generation capabilities, though a noticeable increase in CAPEX amid steady earnings and cash flows suggests strategic reinvestment opportunities.
Balance Sheet & Leverage Analysis ⚠️
Analyzing balance sheet metrics helps determine the company's financial strength, debt levels, and liquidity status.
| Year | 2025 | 2024 | 2023 |
|---|---|---|---|
| Debt-to-Equity | 12.95% | 25.72% | 54.44% |
| Debt-to-Assets | 9.20% | 16.82% | 29.21% |
| Debt-to-Capital | 11.46% | 20.46% | 35.25% |
| Net Debt to EBITDA | 0.02 | 0.11 | 1.44 |
| Current Ratio | 4.44 | 4.17 | 3.52 |
| Quick Ratio | 3.88 | 3.67 | 2.73 |
The company's leverage ratios indicate a conservative debt profile, with improving liquidity ratios suggesting strong financial stability and prudent capital management strategies.
Fundamental Strength & Profitability 📈
Fundamental analysis provides insights into NVIDIA's core financial health and operational efficacy.
| Year | 2025 | 2024 | 2023 |
|---|---|---|---|
| Return on Equity | 91.87% | 69.24% | 19.76% |
| Return on Assets | 65.30% | 45.28% | 10.61% |
| Net Margin | 55.85% | 48.85% | 16.19% |
| EBIT Margin | 64.58% | 55.93% | 16.47% |
| R&D to Revenue | 9.90% | 14.24% | 27.21% |
The robust ROE and healthy profit margins across the board signify NVIDIA's operational prowess and its ability to leverage R&D for sustained growth.
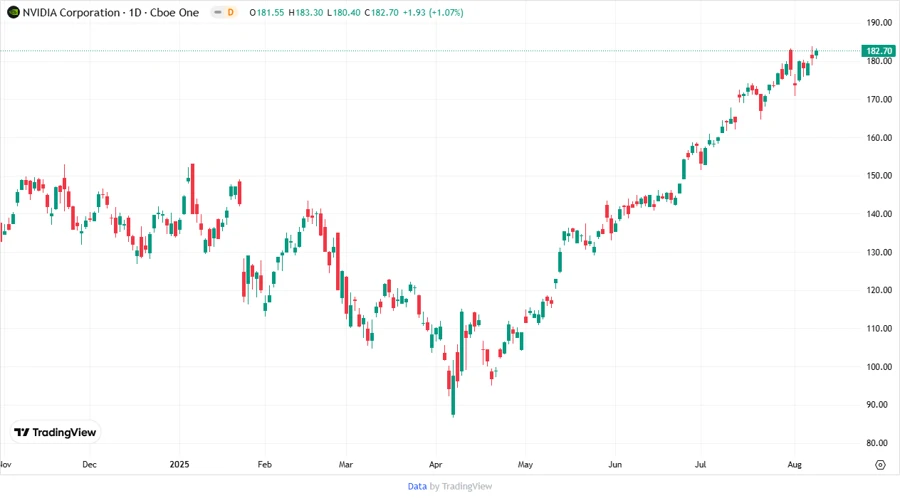
Price Development 📊
Dividend Scoring System 🗣️
| Category | Score | Indicator |
|---|---|---|
| Dividend yield | 2 | |
| Dividend Stability | 4 | |
| Dividend growth | 3 | |
| Payout ratio | 3 | |
| Financial stability | 5 | |
| Dividend continuity | 4 | |
| Cashflow Coverage | 3 | |
| Balance Sheet Quality | 4 |
Total Score: 28/40
Rating ✅
NVIDIA Corporation, with a strong market position and consistent dividend payouts, offers a compelling case for investors seeking growth and moderate income. While the yield remains low, the company's financial health and strategic growth initiatives position it favorably fort long-term shareholder value creation.
Smart Data Insight
Master the Perfect Entry & Exit for this Stock
Don't leave your profits to chance. Historically, this stock follows specific seasonal patterns that institutional traders use to maximize returns.
- ✅ Identify the "Golden Buying Window"
- ✅ Avoid high-risk correction cycles
- ✅ Backtested data from the last 20+ years