March 11, 2026 a 03:15 pm
NUE: Fibunacci Analysis - Nucor Corporation
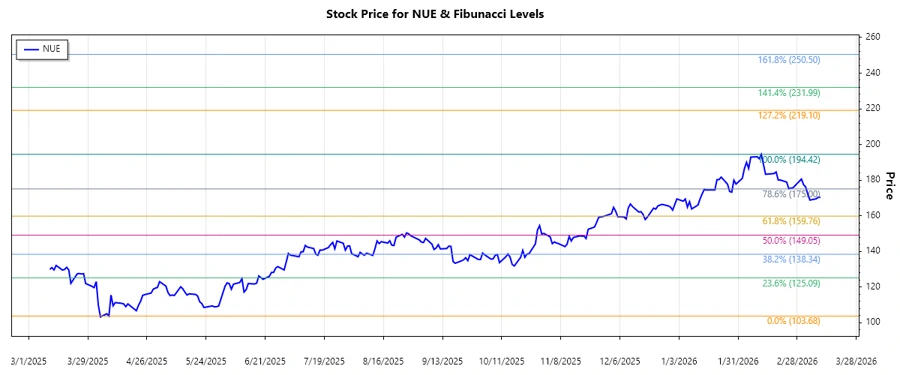
Nucor Corporation (NUE) has experienced a significant upward trend since November 2025. This trend reflects the company's strong position in the steel industry, driven by steady demand across its subsidiaries. Investors are observing the stock closely as it approaches potential resistance levels, which could indicate future price movements.
Fibonacci Analysis
| Attribute | Details |
|---|---|
| Trend Analysis Period | From 2025-05-23 to 2026-02-11 |
| High (Price & Date) | 194.42 on 2026-02-11 |
| Low (Price & Date) | 103.68 on 2025-04-08 |
Fibonacci Retracement Levels
| Retracement Level | Price |
|---|---|
| 0.236 | 137.21 |
| 0.382 | 151.92 |
| 0.5 | 161.05 |
| 0.618 | 170.17 |
| 0.786 | 183.29 |
| Current Price | 168.75 |
The current price is hovering slightly above the 0.618 Fibonacci level, indicating a potential support zone.
Technically, if the price holds at this level, it may act as a support, suggesting a continuation of the upward trend. If it breaks below, it could test the 0.5 level as the next support.
Conclusion
Nucor Corporation's stock has exhibited a robust upward trend, peaking in early February 2026. With the stock price currently in a retracement phase, the 0.618 Fibonacci level may serve as a critical support point. Analysts consider this level significant, as maintaining it could bolster bullish sentiment. However, a breach could suggest further downside exploration, offering both opportunities and risks for traders. Nucor's solid industry positioning provides fundamental backing, but market conditions and steel demand will continue to influence stock performance.