November 05, 2025 a 11:44 am
NUE: Fibonacci Analysis - Nucor Corporation
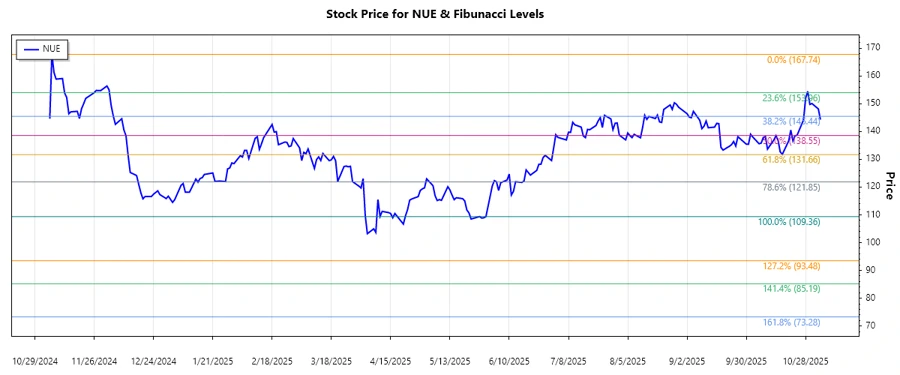
The price of Nucor Corporation (NUE) reflects the dynamics and challenges of the steel industry. Over recent months, the stock has shown significant variations indicative of both economic pressures and opportunities within sectoral demands. Particularly, the technical formation suggests a bearish trend interrupted by short recoveries. Understanding this trend through Fibonacci analysis could provide insights on potential market movements.
Fibonacci Analysis
| Element | Details |
|---|---|
| Trend Period | 2024-11-06 to 2025-11-04 |
| High Point | $167.74 (2024-11-06) |
| Low Point | $109.36 (2025-05-30) |
| Fibonacci Levels | Price |
|---|---|
| 0.236 | $123.89 |
| 0.382 | $135.12 |
| 0.5 | $138.35 |
| 0.618 | $141.58 |
| 0.786 | $147.11 |
The current stock price at $144.29 is within the 0.618 and 0.786 retracement levels, indicating a potential resistance zone where sellers may dominate. A breakout above this range could signal a bullish reversal, but failure to break past this level might reinforce the bearish trend.
Conclusion
The analysis of Nucor Corporation's stock highlights both risks and opportunities within its price movements. With the current price nearing higher Fibonacci levels, investors should be cautious of potential resistance. Should the price break above the identified retracement levels, it may suggest renewed investor confidence and the potential for price recovery. Conversely, failure to break these levels could result in a continued bearish trend. The fluctuating steel market and broader economic factors, however, remain influential, necessitating a careful approach to investment decisions.
Smart Data Insight
Master the Perfect Entry & Exit for this Stock
Don't leave your profits to chance. Historically, this stock follows specific seasonal patterns that institutional traders use to maximize returns.
- ✅ Identify the "Golden Buying Window"
- ✅ Avoid high-risk correction cycles
- ✅ Backtested data from the last 20+ years