October 17, 2025 a 10:15 am
NUE: Fibonacci Analysis - Nucor Corporation
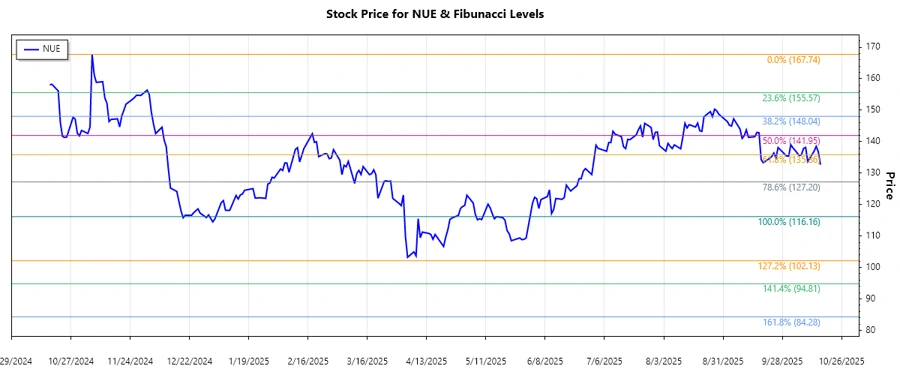
The Nucor Corporation, a leading player in the steel manufacturing sector, has demonstrated resilience in its market. Recent trends reveal price fluctuations typical of the volatile steel industry but underscore an underlying resilience. This analysis leverages Fibonacci retracement to provide potential support and resistance levels. Current price movements suggest areas of interest for traders focusing on retracement levels.
Fibonacci Analysis
| Detail | Value |
|---|---|
| Analyzed Trend Period | Start: 2024-11-06, End: 2025-10-16 |
| High | 167.74 (2024-11-06) |
| Low | 116.16 (2025-05-16) |
| Fibonacci Levels |
|
| Current Price Analysis | The current price is 132.66 and is close to the 0.236 retracement level |
| Technical Interpretation | The price hovering near the 0.236 level may imply minor support, potential for a rebound, or further decline towards deeper retracement levels. |
Conclusion
Nucor's stock price has experienced a significant downtrend since reaching a peak in late 2024. The current price proximity to the 0.236 Fibonacci level suggests possible stabilization in the near-term. However, testing deeper Fibonacci levels could highlight further support areas. For investors, this could present a buying opportunity if price rebounds occur at these levels, although caution is warranted given the recent downward pressure. As such, monitoring these levels provides strategic points for both entry and exit decisions within this cyclical sector.
Smart Data Insight
Master the Perfect Entry & Exit for this Stock
Don't leave your profits to chance. Historically, this stock follows specific seasonal patterns that institutional traders use to maximize returns.
- ✅ Identify the "Golden Buying Window"
- ✅ Avoid high-risk correction cycles
- ✅ Backtested data from the last 20+ years