
June 18, 2026 a 03:31 am

NUE: Dividend Analysis - Nucor Corporation
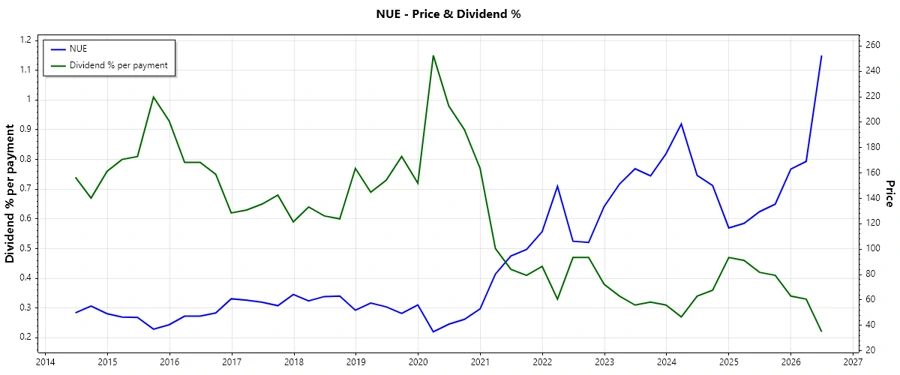
Nucor Corporation is recognized for its solid dividend history, having maintained dividends for 44 years. With a modest dividend yield of 0.88%, the company attracts investors seeking steady returns. Despite this low yield, its continuous enhancement of dividend payouts over decades adds a layer of reliability.
Overview 📊
In analyzing Nucor Corporation, it is evident that the company operates within a robust sector. Below is a snapshot of key dividend-related figures:
| Attribute | Details |
|---|---|
| Sector | Steel |
| Dividend Yield | 0.88% |
| Current Dividend per Share | 2.22 USD |
| Dividend History | 44 years |
| Last Cut or Suspension | None |
Dividend History 🗣️
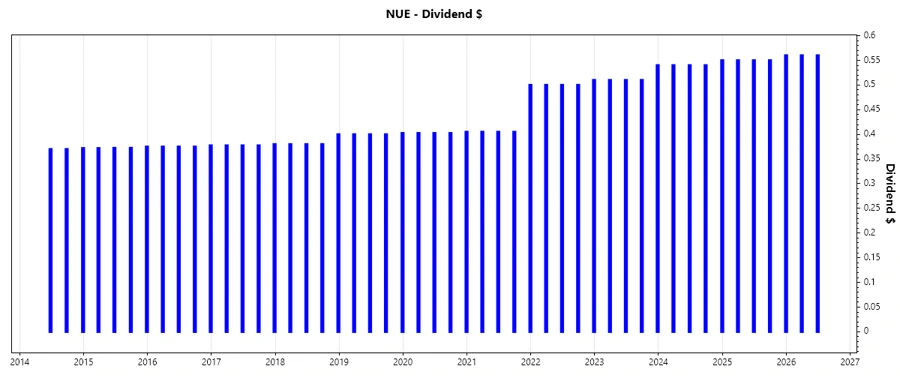
Examining Nucor's dividend history reveals a longstanding commitment to shareholder returns, pivotal for those seeking reliable dividend income. This history not only signifies stability but also a degree of prosperity in adherence to payout policies.
| Year | Dividend per Share (USD) |
|---|---|
| 2026 | 1.12 |
| 2025 | 2.21 |
| 2024 | 2.17 |
| 2023 | 2.07 |
| 2022 | 2.01 |
Dividend Growth 📈
Assessing the dividend growth offers insight into the company's fiscal discipline and growth trajectory. An emphasis is placed on sustained growth which reflects positively on its financial strategies.
| Time | Growth |
|---|---|
| 3 years | 3.21% |
| 5 years | 6.51% |
The average dividend growth is 6.51% over 5 years. This shows moderate but steady dividend growth, indicative of a reliable income stream for investors.
Payout Ratio ✅
Understanding payout ratios helps investors gauge company earnings distributed as dividends. A balanced payout strategy ensures sustainability and indicates fiscal health.
| Key figure | Ratio |
|---|---|
| EPS-based | 21.79% |
| Free cash flow-based | 95.01% |
The EPS-based ratio of 21.79% suggests a conservative payout approach maintaining ample reinvestment capability, while the 95.01% FCF ratio indicates strong dividend coverage, albeit leaving less room for other financial activities.
Cashflow & Capital Efficiency ⚠️
Cashflow and capital efficiency are critical in ensuring ongoing operational liquidity and effective deployment of funds. Monitoring these metrics over the years highlights trends and possible areas of concern or strength.
| Metric | 2025 | 2024 | 2023 |
|---|---|---|---|
| Free Cash Flow Yield | -0.50% | 2.90% | 11.27% |
| Earnings Yield | 4.63% | 7.29% | 10.41% |
| CAPEX to Operating Cash Flow | 105.81% | 79.74% | 31.13% |
| Stock-based Compensation to Revenue | 0.41% | 0.43% | 0.37% |
| Free Cash Flow / Operating Cash Flow Ratio | -5.81% | 20.26% | 68.87% |
Nucor demonstrates a positive trend in cash flow ratios, with a particularly strong free cash flow yield in 2023, signaling robust operational efficiency.
Balance Sheet & Leverage Analysis 📉
Analyzing leverage and solvency metrics reveals insights into a company's capital structure and ability to meet long-term obligations. A stable balance sheet often ensures strategic maneuverability amidst market changes.
| Metric | 2025 | 2024 | 2023 |
|---|---|---|---|
| Debt-to-Equity | 0.34 | 0.34 | 0.33 |
| Debt-to-Assets | 0.20 | 0.20 | 0.19 |
| Debt-to-Capital | 0.25 | 0.26 | 0.25 |
| Net Debt to EBITDA | 1.18 | 0.76 | 0.06 |
| Current Ratio | 0.00 | 0.00 | 3.57 |
| Quick Ratio | 1.57 | 1.48 | 2.35 |
| Financial Leverage | 1.68 | 1.67 | 1.69 |
The company's manageable leverage ratios combined with strong interest coverage point towards robust financial stability, fostering confidence in creditworthiness.
Fundamental Strength & Profitability 🤝
Profitability metrics provide a comprehensive view of a company's core operational efficacy and competitive edge in generating cost-effective revenue. These figures are critical for gauging intrinsic firm value.
| Metric | 2025 | 2024 | 2023 |
|---|---|---|---|
| Return on Equity | 8.33% | 9.99% | 21.61% |
| Return on Assets | 4.97% | 5.97% | 12.80% |
| Margins: Net | 5.37% | 6.60% | 13.03% |
| Margins: EBIT | 8.08% | 10.18% | 18.78% |
| Margins: EBITDA | 12.64% | 14.60% | 22.15% |
| Margins: Gross | 11.93% | 13.35% | 22.51% |
| Research & Development to Revenue | 0.00% | 0.00% | 0.00% |
Nucor's robust margins and returns underscore its operational strengths, further implicating continued profitability and investor appeal amidst fiscal challenges.
Price Development 📈
Dividend Scoring System 🏆
| Criterion | Score | Score Bar |
|---|---|---|
| Dividend Yield | 2 | |
| Dividend Stability | 5 | |
| Dividend Growth | 3 | |
| Payout Ratio | 4 | |
| Financial Stability | 4 | |
| Dividend Continuity | 5 | |
| Cashflow Coverage | 3 | |
| Balance Sheet Quality | 4 |
Overall Score: 30/40
Rating ⭐
Nucor Corporation proves to be a dependable dividend-paying company with a commendable track record of consistency and financial resilience. While the dividend yield is relatively low, the combination of robust growth potential and strategic fiscal policies make it a suitable choice for conservative income-focused portfolios.
Smart Data Insight
Master the Perfect Entry & Exit for this Stock
Don't leave your profits to chance. Historically, this stock follows specific seasonal patterns that institutional traders use to maximize returns.
- ✅ Identify the "Golden Buying Window"
- ✅ Avoid high-risk correction cycles
- ✅ Backtested data from the last 20+ years