April 20, 2026 a 07:31 am
NUE: Dividend Analysis - Nucor Corporation
Nucor Corporation presents a compelling opportunity for investors seeking exposure to the Materials sector with its consistent dividend history and stability. Notably, the company boasts a dividend yield of 0.66 %, paired with a long-standing history of 44 years without a cut or suspension. With a maturation dividend growth strategy over the past years, potential for income growth remains substantial.
📊 Overview
The overview section provides a snapshot of Nucor Corporation’s key dividend metrics, reflecting the company’s sector standing and growth potential.
| Metric | Value |
|---|---|
| Sector | Materials |
| Dividend yield | 0.66 % |
| Current dividend per share | 2.22 USD |
| Dividend history | 44 years |
| Last cut or suspension | None |
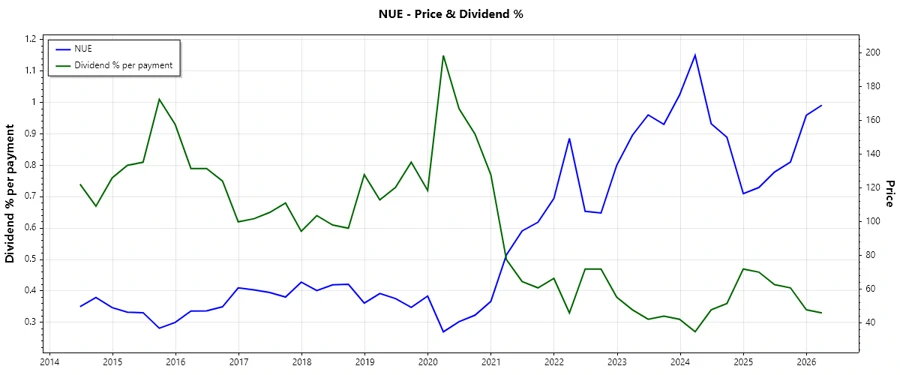
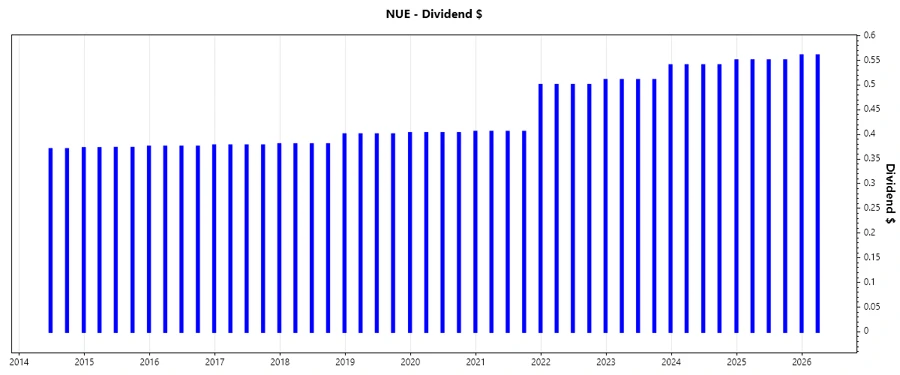
📈 Dividend History
Nucor’s solid dividend history spans over decades, underscoring its reliability for dividend-seeking investors. This history highlights the company’s commitment to returning value to shareholders.
| Year | Dividend per share (USD) |
|---|---|
| 2026 | 0.56 |
| 2025 | 2.21 |
| 2024 | 2.17 |
| 2023 | 2.07 |
| 2022 | 2.01 |
📈 Dividend Growth
Monitoring dividend growth is crucial as it signifies a company's potential for increased future payouts, enhancing shareholder value.
| Time | Growth |
|---|---|
| 3 years | 3.21 % |
| 5 years | 6.51 % |
The average dividend growth is 6.51 % over 5 years. This shows moderate but steady dividend growth, reflecting robust financial health.
📉 Payout Ratio
The payout ratio is an indicator of dividend sustainability. Evaluating these ratios helps to understand how well earnings cover the dividend obligations.
| Key figure | Ratio |
|---|---|
| EPS-based | 29.18 % |
| Free cash flow-based | -268.89 % |
With an EPS payout ratio of 29.18 %, dividends appear sustainable. However, the negative FCF payout ratio indicates potential cash flow concerns impacting future dividend stability.
💰 Cashflow & Capital Efficiency
Evaluating cash flow and capital efficiency helps determine a company's financial stability and growth potential from operational activities.
| Metric | 2023 | 2024 | 2025 |
|---|---|---|---|
| Free Cash Flow Yield | 11.27 % | 2.90 % | -0.50 % |
| Earnings Yield | 10.41 % | 7.29 % | 4.63 % |
| CAPEX to Operating Cash Flow | 0.31 | 0.80 | 1.06 |
| Stock-based Compensation to Revenue | 0.37 % | 0.43 % | 0.41 % |
| Free Cash Flow / Operating Cash Flow Ratio | 0.69 | 0.20 | -0.06 |
Despite a strong earnings yield, there's notable volatility in cash flow metrics, highlighting pressure on capital efficiency and operational performance.
🗣️ Balance Sheet & Leverage Analysis
Balance sheet assessments gauge a company’s financial resilience, helping investors understand capital structures and leverage.
| Metric | 2023 | 2024 | 2025 |
|---|---|---|---|
| Debt-to-Equity | 0.33 | 0.34 | 0.34 |
| Debt-to-Assets | 0.19 | 0.20 | 0.20 |
| Debt-to-Capital | 0.25 | 0.26 | 0.25 |
| Net Debt to EBITDA | 0.06 | 0.76 | 1.18 |
| Current Ratio | 3.57 | 2.51 | 2.94 |
| Quick Ratio | 2.35 | 1.48 | 1.57 |
| Financial Leverage | 1.69 | 1.67 | 1.68 |
Consistent debt ratios suggest controlled leverage, while healthy current and quick ratios imply robust liquidity management.
📈 Fundamental Strength & Profitability
Assessing fundamental strength involves analyzing profitability and efficiency metrics, vital for long-term investment horizons.
| Metric | 2023 | 2024 | 2025 |
|---|---|---|---|
| Return on Equity | 21.61 % | 9.99 % | 8.33 % |
| Return on Assets | 12.80 % | 5.97 % | 4.97 % |
| Net Margin | 13.03 % | 6.60 % | 5.37 % |
| EBIT Margin | 18.78 % | 10.18 % | 8.08 % |
| EBITDA Margin | 22.15 % | 14.60 % | 12.64 % |
| Gross Margin | 22.51 % | 13.35 % | 11.93 % |
| R&D to Revenue | 0 % | 0 % | 0 % |
High ROE and ROA in recent years illustrate proficient asset use, though descending margin trends highlight potential profitability challenges.
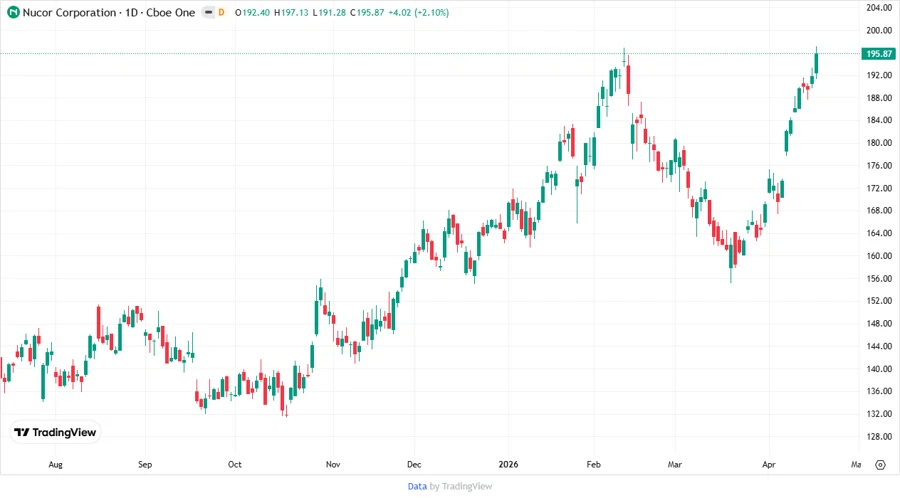
✅ Price Development
🏆 Dividend Scoring System
| Criteria | Score (/5) | Score Bar |
|---|---|---|
| Dividend yield | 3 | |
| Dividend Stability | 5 | |
| Dividend growth | 4 | |
| Payout ratio | 3 | |
| Financial stability | 4 | |
| Dividend continuity | 5 | |
| Cashflow Coverage | 3 | |
| Balance Sheet Quality | 4 |
Total Score: 31/40
⭐ Rating
Overall, Nucor Corporation offers a stable dividend yield and consistent growth track record within the Materials sector, making it a valuable asset for income-oriented portfolios. Despite some concerns regarding cash flow volatility, the company’s sound financial structure provides a confident outlook for sustained dividend distributions.