July 06, 2025 a 08:15 am

NTRS: Trend and Support & Resistance Analysis - Northern Trust Corporation
The Northern Trust Corporation (Ticker: NTRS) has recently exhibited a notable uptrend, reflecting its robust strategies in wealth management and asset servicing sectors. The technical indicators suggest a bullish momentum as EMA calculations underline a favorable market sentiment. Investors might find both opportunities and challenges, as understanding the support and resistance zones can offer strategic entry and exit points. Evaluating these aspects may provide a clearer picture for potential investors and analysts.
Trend Analysis
The recent stock performance of Northern Trust Corporation showcases a marked uptrend. The calculated Exponential Moving Averages (EMA) indicate:
- EMA20 is greater than EMA50, signaling a ▲ bullish trend.
- The EMA20 at 121.57 surpasses the EMA50 at 112.44, supporting the upward momentum.
| Date | Close Price | Trend |
|---|---|---|
| 2025-07-03 | 131.70 | ▲ |
| 2025-07-02 | 132.06 | ▲ |
| 2025-07-01 | 127.99 | ▲ |
| 2025-06-30 | 126.79 | ▲ |
| 2025-06-27 | 124.41 | ▲ |
| 2025-06-26 | 122.97 | ▲ |
| 2025-06-25 | 123.80 | ▲ |
Conclusively, the upward-trending EMA suggests bullish market conditions, implying potential growth for Northern Trust Corporation if the current trend continues.
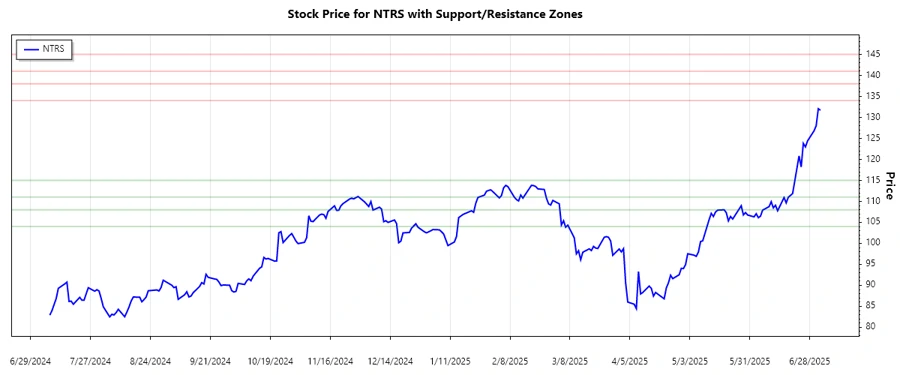
Support and Resistance
Recent analysis of NTRS price movements has identified significant support and resistance zones:
| Zone Type | From | To | Direction |
|---|---|---|---|
| Support | 111.00 | 115.00 | ▼ |
| Support | 104.00 | 108.00 | ▼ |
| Resistance | 134.00 | 138.00 | ▲ |
| Resistance | 141.00 | 145.00 | ▲ |
The current close price of $131.70 is near a crucial support zone, indicating a potential consolidation phase before breaking through the resistance zone.
Conclusion
In summary, Northern Trust Corporation's stock is demonstrating an encouragingly strong uptrend, with calculated EMAs supporting continued bullish activities. While the stock is approaching critical resistance levels, its ability to establish new highs could attract further investor interest. However, the possibility of a consolidation phase remains unless it breaks through identified resistance zones. Analysts should pay close attention to these zones for potential reversal or breakout signals. As always, remaining vigilant to market changes is key to leveraging potential opportunities.
Smart Data Insight
Master the Perfect Entry & Exit for this Stock
Don't leave your profits to chance. Historically, this stock follows specific seasonal patterns that institutional traders use to maximize returns.
- ✅ Identify the "Golden Buying Window"
- ✅ Avoid high-risk correction cycles
- ✅ Backtested data from the last 20+ years